| |  |  | | Lake Pontchartrain Atlas: | | | | | | | | | | | | | | | | | | | | | | | | | | | | | | | Environmental Issues |  | | | | | | | | | | | | | |  | | | | | | | | | | |  | Environmental Issues - Bonnet Carré Diversion: March 17 - April 18, 1997 Contributors: Flocks, Stumpf, Kindinger To avoid devastating flooding in the major metropolitan areas of the lower Mississippi River valley, Congress implemented the Flood Control Act of 1929. This act led to the implementation of the Mississippi River and Tributaries Project by the USACE. Among a complex system of flood control structures, the project includes levees to contain flood flows and floodways to redirect excess flows away from the Mississippi River. One such structure is the Bonnet Carré Spillway which diverts flood waters from the River to Lake Pontchartrain (Figure 49). The Spillway is situated upriver from New Orleans along the Lake's southwest shore, and is designed to reduce flow at New Orleans by up to 250,000 cubic feet per second (cfs) (Figure 48). The Spillway includes a floodgate which opens a portion of the east bank of the River to a 9.7 km (6 mi) floodway between the River and the Lake. The floodgate has been opened eight times since its inception, most recently during spring floods in 1997. 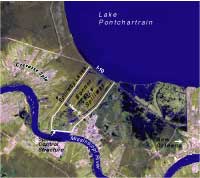 | |  | | Figure 48: Satellite (LANDSAT-TM) Image: Bonnet Carré Spillway. Click on the image for a larger version. | | Figure 49: Floodways and flow distribution during major floods. The numbers represent cubic feet per second. Click on the image for a larger version. | The spring of 1997 saw record flooding in the central states of the Mississippi River drainage basin. Down-river, water flow exceeded flood stage by early March and remained high through April. At Natchez, MS the River rose to 2.4 m (8 ft) above floodstage, which amounts to over 2,000,000 cfs (Figure 50). This volume is enough to fill the New Orleans Superdome every second. To reduce peak flow in New Orleans, the Bonnet Carré Spillway was opened on March 17 and remained open until April 18 (Figure 51). On March 27 and 28, diversion through the Spillway exceeded 240,000 cfs or 12% of the River's flow. The diversion possibly prevented an estimated $26 billion in damages to New Orleans, and the consequences were clearly observed in the Lake. The total volume of sediment-laden water entering the Lake was equal to two times the Lake's volume. The circulation of this turbid water through the Lake is seen in the satellite imagery. Subsequent algal blooms as a result of increased nutrient levels from the floodwaters were also observed (Waters et al., 2000).  | | 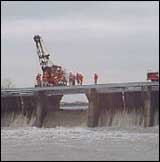 | | Figure 50: Flood gauge in Natchez, MS, Jan 15 - May 30, 1997. | | Figure 51: Opening of the Bonnet Carré Spillway on March 17, 1997. | Water Turbidity in Lake Pontchartrain Following Bonnet Carré Spillway Opening AVHRR Imagery (turbidity): These images of Lake Pontchartrain, Louisiana were derived from data collected by the Advanced Very High Resolution Radiometer (AVHRR) onboard NOAA polar-orbiting weather satellites (Figure 52). Water reflectance measured in the visible and near-infrared wavelengths are determined with corrections for atmospheric effects and converted to provisional estimates of suspended sediment concentration (seston) and diffuse attenuation coefficient (K). These values have not been validated and are provided for context only. Clouds are masked in gray while land is masked in brown. These images illustrate the increase in suspended material in the Lake as a result of the diversion of Mississippi River flood waters.  | |  | |  | | March 6, 1997 | | March 8, 1997 | | March 23, 1997 |  | |  | |  | | March 26, 1997 | | April 7, 1997 | | April 9, 1997 | | Figure 52: Satellite imagery (AVHRR) showing migration of turbid plume across the lake during the Spillway opening. Click on the individual images for larger versions. | Algal Blooms in Lake Pontchartrain Following Bonnet Carré Spillway Opening\ AVHRR Imagery (reflectance): These images are composed of channel 1 (visible) displayed in green and blue and channel 2 (near-IR) displayed in red (Figure 53). The algal mat floating on the surface of the Lake appears as pink or red due to its high reflectance in the near-infrared. The thin red edge along the shore in most images is vegetation at the coast that is not masked out. However, by June 14 the bulk of the bloom had moved to the south shore near New Orleans. Increased nutrient levels in Mississippi River floodwaters led to an explosion of nutrient-fixing blue-green algae (cyanobacteria). The bloom became apparent over large parts of the Lake by the end of May, peaking in mid-June The blooms produced high levels of heptatoxins which were measured during the peak of the blooms with traces persisting into the fall (Dortch et al., 1998).  | |  | | June 4, 1997 | | June 7, 1997 |  | |  | | June 13, 1997 | | June 14, 1997 | | Figure 53: Satellite imagery (AVHRR) showing development of algal mats on the lake surface. Click on the individual images for larger versions. | « Previous | Next » |