OF 07-1247: Afghanistan Aeromagnetic Data Processing
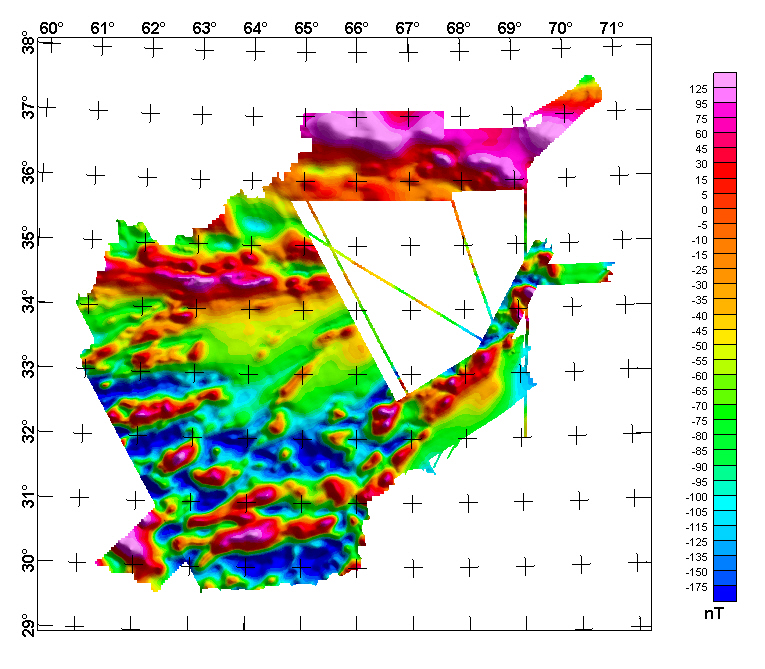
Afghanistan Composite Magnetic Anomaly Map at 5000 m Above Ground
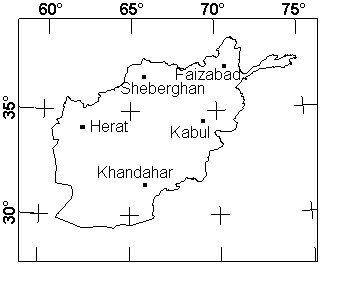
DATA PROCESSING DETAILSA typical aeromagnetic survey uses a single base station magnetometer to record the time-varying magnetic fields produced by currents in the earth's upper atmosphere. Because these time-varying fields are unrelated to the geological sources of interest, they are subtracted from the magnetic field measured by the aircraft. For best results, a single base station should be located on the ground near the center of the area to be flown. If the aircraft gets too far away from the base station, the time-varying fields seen at the aircraft will differ from those seen at the base station, resulting in increased error. The effective range of a single base station is generally considered to be less than 100 km. Due to the large area covered by the Afghanistan aeromagnetic survey, a single magnetic base station would not have provided adequate coverage. Instead, five base station magnetometers were in operation during the survey. These were located at Sheberghan, Faizabad, Herat, Kabul, and Khandahar. In order to correct the airborne magnetic data for time variations, it was decided to use a weighted average of data from the five base stations to predict the time-varying field at the aircraft.
The first step in constructing this weighted average was to determine the constant magnetic field value at each base station. This constant value is related to the local geology at the base station and is best measured near local midnight, when the currents in the upper atmosphere are at their lowest level. For all of the night recordings at the base stations, we determined the magnetic field value at midnight (19:30 UT), the average value for one hour near midnight (19:00 to 20:00 UT), and the average value for two hours near midnight (18:30 to 20:30 UT). In general, these three values were not very different for a given base station on a given night. However, we did notice that on certain nights all the midnight values for all base stations were systematically high, and on other nights systematically low. This meant that it was important that we use the same set of nights to determine the average midnight values for all the base stations. In the end we used a fixed set of 22 nights to determine the average midnight field value at each base station. In determining this average, it did not matter if we used the measured midnight values at the base station, the one-hour averages about midnight, or the two-hour averages about midnight. The results were the same to within 1 nT. The average midnight value for each base station was subtracted from all magnetic readings at the base station. This resulted in corrected values for the time-varying magnetic field at each base station. The second step in the processing involved removing spikes and noise from the base station readings, some of which were found to be noisier than others. To prevent this noise from propagating into the predicted time-varying field at the aircraft, we applied a three-point non-linear filter to all base station data to remove spikes and noise. The third step in predicting the time-varying magnetic field at any aircraft location was to fit a time-varying surface to the corrected base station data. The surface was defined such that each point on the surface lies on a plane defined by a weighted fit to the five base station values. We used the inverse distance from the observation point (the aircraft) to each base station as a weighting function. This choice of surface has several good features. The surface is continuous, it does not peak over the base stations nor sag away from them. The surface can be evaluated at any point in space, except at the actual base station locations where it is infinite. The predicted value on the surface is weighted most heavily by the nearest base station value. The above approach for removing the time-varying magnetic field provided a visible improvement over the raw aircraft data. Additional processing was necessary to remove line-leveling noise and elevation variations. The final diurnally corrected magnetic data had some remaining flight-line noise due to variable flight altitudes and possible compensation issues. A determination was made to continue all flight and tie lines to a nominal altitude of 5000 m above terrain. Using Oasis montaj software �drape1D.gx�, the data were analytically continued to the stated height for compatibility with previously collected data using 10 continuation levels and the default low-pass filter factor of 1.0. The data were then tie-line and flight-line leveled, as well as microleveled in some cases, using Oasis montaj to create the final magnetic anomaly grids. These final magnetic anomaly grids were subsequently merged with the ground magnetic survey data described in this report and the residual magnetic field data found in U.S. Geological Survey Open-File Report 2006-1206 and Open-File Report 2006-1325. All grids were first continued to the nominal elevation of 5000 m above terrain. Subsequent grid merges were then performed using the Oasis montaj grid-stitching algorithm 'gridstch.gx,' with a static shift applied to the ground magnetic survey grid and a constant slope shift applied to the data from each of the two open-file reports. The slope shift was necessary due to the uncertainty in knowing the accuracy of the the main field that had been removed from the earlier survey.
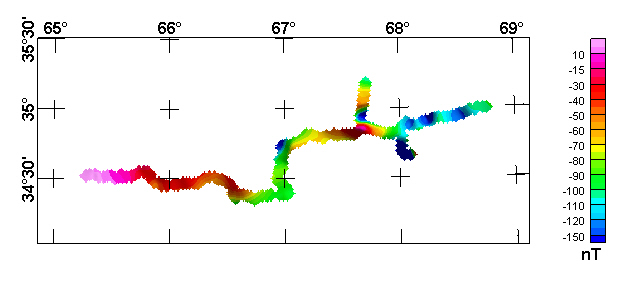
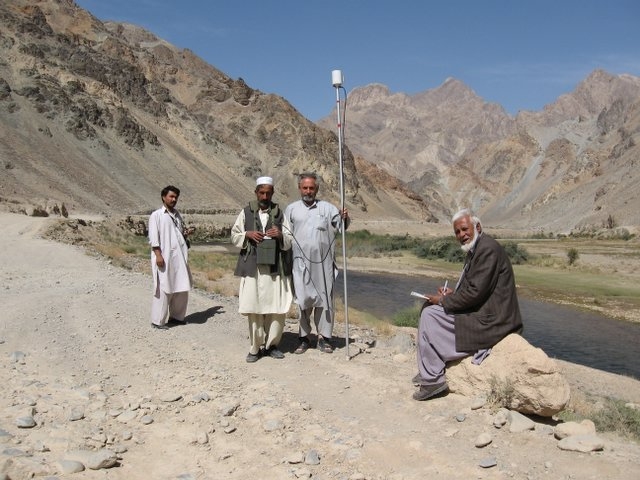
AFGHANISTAN GEOLOGICAL SURVEY GROUND TOTAL MAGNETIC FIELD INTENSITY SURVEYIn September 2006 the Afghanistan Geological Survey (AGS) conducted a ground survey of the total magnetic field intensity of the area between the Ghowr Band River north of Kabul in the Parvan Province to the city of Chaghcharan in the Ghowr Province of Afghanistan. The AGS Survey team (fig. 3) was comprised of three Afghan engineers and one driver. Total magnetic field intensity measurements were conducted approximately every three km over a distance of 400 km. The Geometrics G-856 memory magnetometer was used to collect the total field readings. A Garmin eTrex vista GPS system was used to record positional information for each of the magnetometer stations. The G-856 system clock was synced to Coordinated Universal Time (UTC).
The base station magnetometer used for this study was a GEM System GSM-19 Overhauser magnetometer. The base station magnetometer uses GPS time signals to sync the time to UTC time reference. The base station was located at Charsad Bistar (Afghanistan National Army military hospital) in Kabul, Afghanistan (N34�32.422�, E69�11.677�). The GSM-19 was set up with a 30 second repetition rate for data collection. The field measurements were downloaded from the G-856 and diurnally corrected using the diurnal measurements from the changes in the total field intensity recorded by the GSM-19 in Kabul. The 2005 International Geomagnetic Reference Field (IGRF) was then subtracted from the diurnally corrected data. The residual total magnetic field intensity was then upward continued 5 km above terrain and merged with the airborne magnetic survey data. This geophysical survey was the first conducted by the AGS Geophysical team in 16 years. The effort comprised five days of field work and one day of data processing. DATA PRODUCTSAll grids are presented in Geosoft binary grid format, with two files describing each of the grids (suffixes .grd and .gi). All databases are presented in two formats: Geosoft binary database format and Geosoft ASCII XYZ format. All formats can be converted using the free conversion software offered by Geosoft at http://www.geosoft.com/.
PROJECTION SPECIFICATIONSAll databases, maps, grids, and xyz files in this report use the following projection specifications:
This web site makes available to users the data products mentioned above for this survey. To view this directory, click on the link below. To view the README file ("readme_Afghan_datafiles.pdf") describing the aeromagnetic data product files, click on the README line following. README_Afghan_datafiles.pdf file describing data in above directory |
Version 1.0 Posted April 2008
Refer to the README_Afghan_datafiles PDF describing data in above directory
For more information about this |

![]() U.S. Department of the Interior | U.S. Geological Survey
U.S. Department of the Interior | U.S. Geological Survey
URL: http://pubsdata.usgs.gov/pubs/of/2007/1247/html/afghan_dataproc.html
Questions or Assistance: Contact USGS
Last modified: Wednesday, 07-Dec-2016 20:20:02 EST