Skip past header information
USGS - science for a changing world

U.S. Geological Survey Open-File Report 2008-1206

Coastal Change Along the Shore of Northeastern South Carolina: The South Carolina Coastal Erosion Study

Return to: Title and Abstract » Table of Contents » Section 1 » Section 2 » Section 3 » Section 4 » Section 5 » Section 6 » Acknowledgments » References » List of Figures » Acronymns » Glossary
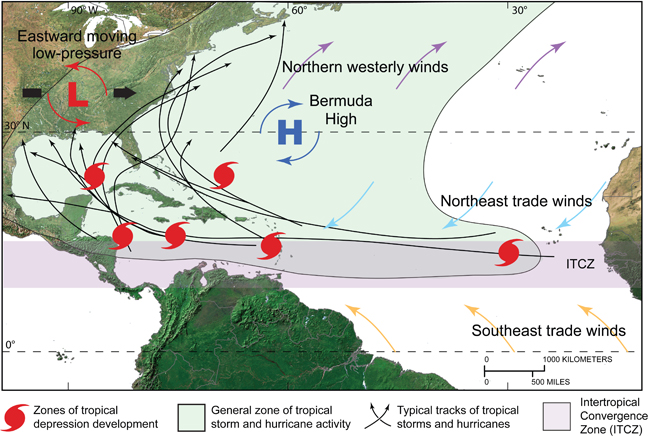

Box #2: Tropical Cyclones

Tropical cyclones, which include tropical storms and hurricanes, develop in the tropical and subtropical regions of the North Atlantic Ocean. They begin as tropical depressions, which are low-pressure systems that exhibit cyclonic (counter-clockwise) circulation. In the presence of favorable atmospheric conditions, warm tropical waters can provide enough energy to allow these systems to organize and strengthen into more powerful storms. Upper-level winds and pressure systems steer these storms into higher latitudes, where some make landfall and wreak havoc along the coast. Others dissipate over the cooler waters of the North Atlantic.

Map of the North Atlantic Ocean showing the area of hurricane and tropical storm activity.

Map of the North Atlantic Ocean showing the area of hurricane and tropical-storm activity (light green). Tropical depressions (red symbols) form within or near the Intertropical Convergence Zone (ITCZ, light purple), a zone of low pressure near the equator where trade winds converge and cause moist air to become unstable and rise. Tropical depressions gain strength from warm surface waters and often intensify into tropical storms and hurricanes as they are forced westward by the trade winds and the anticyclonic (clockwise) rotation of the Bermuda High. The storm paths are also influenced by low-pressure systems that move eastward across continental North America, generally causing the storms to recurve and change their heading towards the north and east.

Tropical cyclones occur during a season that extends from June 1st to November 30th, with the most activity occurring between July and September. On the basis of the measure of sustained wind speeds near the centers of these storms, they are classified as tropical storms, 63-118 km/hr (39-73 mi/hr) or hurricanes, > 119 km/hr (74 mi/hr). The Saffir-Simpson Scale (see below) uses wind speed to further subdivide hurricanes into five categories of intensity, and provides descriptions of the storm surge and types of damage that can be expected with each.

SAFFIR-SIMPSON SCALE

Category

Wind speed

Storm surge*

Potential damage

1

74 - 95 mi/hr
64 - 82 kts
119 - 153 km/hr

4 - 5 ft
1.2 - 1.5 m

MINIMAL. Damage primarily to shrubbery, trees, and mobile homes. Low-lying coastal roads inundated, minor pier damage, small craft torn from moorings.

2

96 - 110 mi/hr
83 - 95 kts
154 - 177 km/hr

6-8 ft
1.8 - 2.4 m

MODERATE. Some trees blown down. Major damage to mobile homes, poorly constructed signs, and piers. Some damage to building roofs, windows, and doors. Flooding damages piers and marinas.

3

111 - 130 mi/hr
96 - 113 kts
178 - 209 km/hr

9 - 12 ft
2.7 - 3.7 m

EXTENSIVE. Many large trees and signs blown down. Some structural damage to small residences and utility buildings. Mobile homes destroyed. Serious flooding, possibly requiring evacuation of low-lying areas.

4

131 - 155 mi/hr
114 - 135 kts
210 - 249 km/hr

13 - 18 ft
4.0 - 5.5 m

EXTREME. Extensive damage to small buildings. Complete destruction of mobile homes. Major erosion of beaches. Flooding far inland, possibly requiring evacuation of areas near the shore.

5

> 155 mi/hr
> 135 kts
> 249 km/hr

> 18 ft
> 5.6 m

CATASTROPHIC. Considerable damage to residences and industrial buildings; some complete structural failures. Extensive flooding possibly requiring evacuation within 5-10 miles (8-16 km) of shore.


*Storm-surge values are highly dependent on the slope
of the continental shelf and the shape of the coastline.

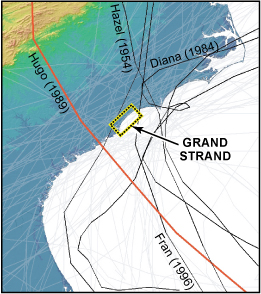
In September 1989, Hurricane Hugo slammed into the South Carolina coast near Charleston as a strong category-4 storm. Large waves severely eroded beaches and dunes in several southeastern states. A maximum storm surge of 6 m (20 ft) completely submerged some low-lying barrier islands north of Charleston. At the time, Hugo was the costliest hurricane to ever hit the U.S. mainland. It remained at category-1 strength all the way to Charlotte, North Carolina, about 300 km (180 miles) inland from the coast, and destroyed many homes, trees, and farms. In South Carolina alone, 29 people were killed and property damages were estimated at $6 billion.

Hurricane Hugo was only one of many hurricanes to impact the South Carolina coast during historical time. From 1871–2008, a total of 33 tropical storms and hurricanes made direct hits on the state, including six major hurricanes of category 3 or higher.

Satellite image of Hurricane Hugo.

Satellite image of Hurricane Hugo on September 21, 1989, just hours before making landfall on the South Carolina coast. Source: NOAA National Hurricane Center.

Map of hurricane tracks that hit or passed near the South Carolina coast from 1851 to 2005.

Image of hurricane tracks that hit or passed near the South Carolina coast from 1851 to 2005. Thin gray lines indicate tropical storms and minor hurricanes (categories 1–2). Black lines indicate major hurricanes (categories 3–5). Red line indicates Hurricane Hugo. Source: NOAA National Hurricane Center.

Additional reading:
Brennan, J.W., 2001, Meteorological summary of Hurricane Hugo, Journal of Coastal Research, Special Issue 8, p. 1-12.


Skip USGS links group

Accessibility FOIA Privacy Policies and Notices

Take Pride in America logo USAGov logo U.S. Department of the Interior | U.S. Geological Survey
[an error occurred while processing this directive] URL: https://pubsdata.usgs.gov
Page Contact Information: Publishing Service Center
Page Last Modified: Wednesday, 07-Dec-2016 21:39:12 EST