
|
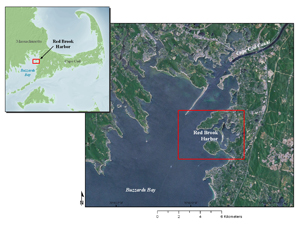 |
Figure 1. Map showing the location of the U.S. Geological Survey geophysical survey of Red Brook Harbor, Massachusetts. (Aerial photography from Environmental Systems Research Institute (2010) World Imagery ArcGIS Map Service, inset hillshade image from [Massachussets] Office of Geographic Information (2010).) |
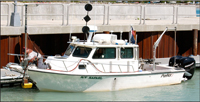 |
Figure 2. Photograph of the U.S. Geological Survey (USGS) Research Vessel Rafael. (Photo by Dave Foster, USGS.) |
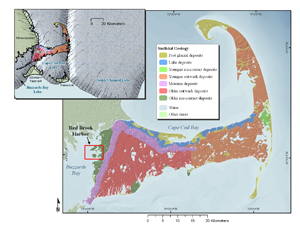 |
Figure 3. Map showing the surficial geology of Cape Cod, Massachusetts, with inset map showing surficial geology superimposed on the southernmost extent of the Laurentide ice sheet (from Oldale, 1992). (Hillshade image from [Massachussets] Office of Geographic Information (2010).) |
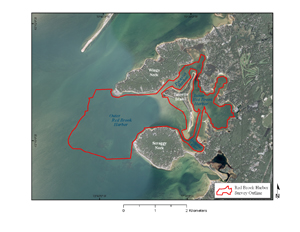 |
Figure 4. Map showing the present day setting of Red Brook Harbor, Massachussetts. Bassets Island, Mass., divides the harbor into an outer and inner harbor. The outer harbor is approximately 10 meters (m) deep, while the inner harbor averages approximately 2 m in depth. The inner harbor is a popular moorage for shallow-draft vessels due to a channel that is dredged to 3 m. (Aerial photography of land areas from Environmental Systems Research Institute (2010) World Imagery ArcGIS Map Service, aerial photography of water areas from [Massachussets] Office of Geographic Information (2010).) |
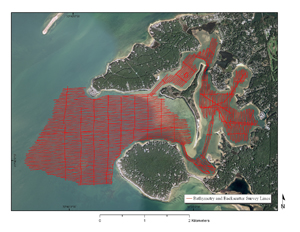 |
Figure 5. Map showing bathymetry and backscatter survey tracklines for the U. S. Geological Survey geophysical survey of Red Brook Harbor, Massachusetts. (Aerial photography of land areas from Environmental Systems Research Institute (2010) World Imagery ArcGIS Map Service, aerial photography of water areas from [Massachussets] Office of Geographic Information (2010).) |
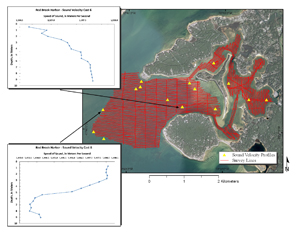 |
Figure 6. Map showing locations of sound velocity profiles (SVP) collected during survey operations in Red Brook Harbor, Massachussetts. Inset plots show SVP for casts six and eight. Plots display the speed of sound in the water column in meters per second on the x-axis, versus water depth in meters on the y-axis. (Aerial photography of land areas from Environmental Systems Research Institute (2010) World Imagery ArcGIS Map Service, aerial photography of water areas from [Massachussets] Office of Geographic Information (2010).) |
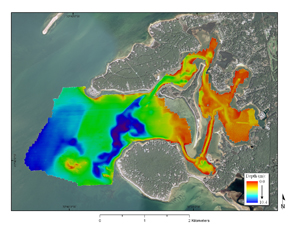 |
Figure 7. Map showing a color-shaded relief image of the bathymetry of Red Brook Harbor, Massachusetts. Bathymetric soundings were collected with an SEA (undated) SWATHplus interferometric sonar system. Depths are reported in meters and range from 0 to 10.4 meters. (Aerial photography of land areas from Environmental Systems Research Institute (2010) World Imagery ArcGIS Map Service, aerial photography of water areas from [Massachussets] Office of Geographic Information (2010).) |
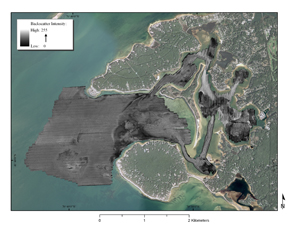 |
Figure 8. Map showing backscatter intensity recorded with an SEA (undated) SWATHplus interferometric sonar system during the U. S. Geological Survey geophysical survey of Red Brook Harbor, Massachusetts. Low backscatter values are represented by dark tones, while high backscatter returns are shown by lighter tones. (Aerial photography of land areas from Environmental Systems Research Institute (2010) World Imagery ArcGIS Map Service, aerial photography of water areas from [Massachussets] Office of Geographic Information (2010).) |
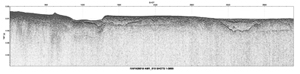 |
Figure 9. Seismic profile collected with a Knudsen Engineering Ltd. (undated) Chirp 3202 dual frequency (3.5- and 200-kilohertz) seismic system. |
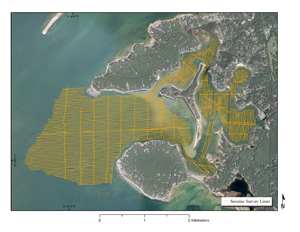 |
Figure 10. Map showing seismic tracklines for the U. S. Geological Survey geophysical survey of Red Brook Harbor, Massachusetts. (Aerial photography of land areas from Environmental Systems Research Institute (2010) World Imagery ArcGIS Map Service, aerial photography of water areas from [Massachussets] Office of Geographic Information (2010).) |
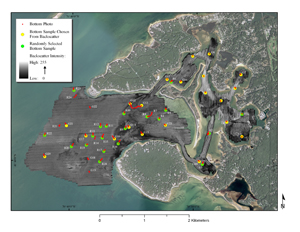 |
Figure 11. Map showing the location of bottom photographs and sediment samples overlying a backscatter mosaic of Red Brook Harbor, Massachussets. Areas of transition between high and low backscatter and large areas of homogeneous backscatter were chosen for 24 of the sample sites. The remaining 24 sample sites were selected with a geographic information system randomization routine and will be used in future habitat modeling efforts. Red dots depict locations of bottom photographs, yellow dots mark sample sites chosen based on backscatter characteristics, and green dots show the locations of sediment sample stations that were chosen randomly. Seven sites marked by photographs only are locations where dense shell cover on the sea floor prohibited the collection of sediment samples. (Aerial photography of land areas from Environmental Systems Research Institute (2010) World Imagery ArcGIS Map Service, aerial photography of water areas from [Massachussets] Office of Geographic Information (2010).) |
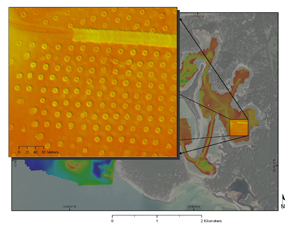 |
Figure 12. Inset map showing a large-scale view of mooring blocks and surrounding scour in the inner portion of Red Brook Harbor, Massachusetts. The location map features a color-shaded relief image of the bathymetry that was recorded with an SEA (undated) SWATHplus interferometric sonar system during the U.S. Geological Survey geophysical survey of Red Brook Harbor. (Aerial photography of land areas from Environmental Systems Research Institute (2010) World Imagery ArcGIS Map Service, aerial photography of water areas from [Massachussets] Office of Geographic Information (2010).) |
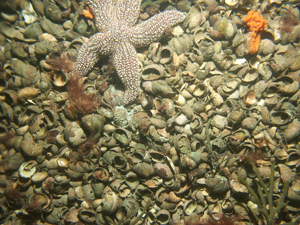 |
Figure 13. Photograph showing dense Atlantic slippersnail shell cover, which is present in much of the outer portion of Red Brook Harbor, Massachussets. The photograph was acquired with the U.S. Geological Survey Mini SEABOSS (Mini SEABed Observation and Sampling System). |
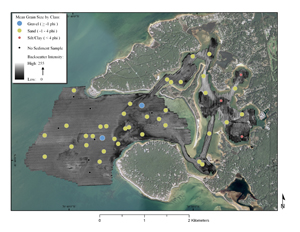 |
Figure 14. Map showing the mean grain size for each sediment sample, grouped into the following three classes: gravel (larger than -1 phi or larger than 2 millimeters (mm) in diameter), sand (4 to -1 phi or 0.062 to 2 mm in diameter), and clay/silt (less than 4 phi or less than 0.0625 mm in diameter). The seven planned sample stations at which it was not possible to collect a sediment sample are marked with small black circles. The background image shows a backscatter mosaic. (Aerial photography of land areas from Environmental Systems Research Institute (2010) World Imagery ArcGIS Map Service, aerial photography of water areas from [Massachussets] Office of Geographic Information (2010).) |
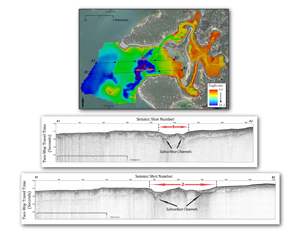 |
Figure 15. Map showing two seismic survey tracklines overlying a color-shaded relief image of Red Brook Harbor, Massachussets, bathymetry. Both tracklines (A1-A2 and B1-B2) were run from west to east. Corresponding seismic profiles show subsurface channels underlying the present-day channel floor. The x-axis in the seismic profiles is shown in shot points, and the y-axis is two-way travel time in seconds. (Aerial photography of land areas from Environmental Systems Research Institute (2010) World Imagery ArcGIS Map Service, aerial photography of water areas from [Massachussets] Office of Geographic Information (2010).) |
|


