U.S. Geological Survey Open-File Report 2010-1146
Coastal Vulnerability Assessment of the Northern Gulf of Mexico to Sea-Level Rise and Coastal Change
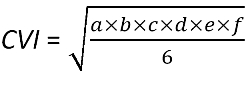
Constructing the database In order to develop a database for the coastal vulnerability assessment, data for each of the six variables described in the Introduction were gathered from previously published data sources (table 1). The coastal vulnerability databases presented here are based on the methodology used by Thieler and Hammar-Klose (1999) (with a few modifications noted below), which modified the approach of an earlier database developed by Gornitz and White (1992). The CVI database was constructed by dividing the GSHHS for the Northern Gulf of Mexico into approximately 1-km coastal segments (Wessel and Smith, 1996). The GSHHS was used in place of the world vector shoreline (Soluri and Woodson, 1990) employed by Thieler and Hammar-Klose (2000b). Data for each of the six variables (geomorphology, shoreline change, coastal slope, relative sea-level rise, significant wave height, and tidal range) were added to the shoreline attribute table for each coastal segment. Next, each variable in each grid cell was assigned a relative vulnerability value from 1 to 5 (1 is very low vulnerability, 5 is very high vulnerability), which is explained in the next section. In this study recently available datasets related to the shoreline change (Miller and others, 2004; Martinez and others, 2006; Barras and others, 2008), sea-level rise (Ivins and others, 2007), and elevation (Divins and Metzger, 2009) are used to update an earlier CVI database (Thieler and Hammar-Klose, 2000b) (table 1). Classifying the data Table 2 shows CVI variables, from both the original Gulf of Mexico CVI and the updated Northern Gulf of Mexico CVI, which include both quantitative and qualitative information. The quantitative variables are assigned a vulnerability ranking based on their actual values, whereas the non-numerical geomorphology variable is ranked qualitatively according to the relative susceptibility of a given landform to physical change (Thieler and Hammar-Klose, 2000b). Shorelines with erosion/accretion rates between -1.0 and +1.0 m/yr are ranked as moderate. Increasingly higher erosion or accretion rates are ranked as correspondingly higher or lower vulnerability (Thieler and Hammar-Klose, 2000b). Regional coastal slopes range from very high vulnerability, <0.30 percent, to very low vulnerability at values >1.20 percent. Here coastal slopes and vulnerability ranges were established using the Coastal Relief Model (3-arc second resolution) (Divins and Metzger, 2009), which replaced the ETOPO-2 (1-minute resolution) dataset used by Thieler and Hammar-Klose (2000b) (U.S. Department of Commerce, 2006). The rate of relative sea-level change is ranked such that rates less than the modern rate of eustatic rise (1.8 mm/yr) are very low vulnerability. Since the global or "background" rate is common to all shorelines, the sea-level ranking reflects primarily local to regional isostatic or tectonic adjustment (Thieler and Hammar-Klose, 2000b). Mean wave height contributions to vulnerability range from very low (<1.1 m) to very high (>2.6 m) (Thieler and Hammar-Klose, 2000b). Tidal range is ranked such that microtidal (<1 m) coasts are very high vulnerability, and macrotidal (>6 m) coasts are very low vulnerability (Thieler and Hammar-Klose, 2000b). Two recent studies, one on land-area change in Louisiana (Barras and others, 2008) and one on sediment compaction and subsidence models (Ivins and others, 2007), are incorporated into the CVI ranking system and used to calculate an updated CVI for the Northern Gulf of Mexico. Because the Ivins and others (2007) vertical movement model is more closely linked to the geologic variability of the region than the water-level recorders, which provide only sparse coverage along the Mississippi Delta, the Ivins and others (2007) dataset was chosen as the relative SLR data source for the updated Northern Gulf of Mexico CVI. Vertical movement rates based on Ivins and others (2007) are ranked such that rates above 5 mm/yr are very high vulnerability, and increasingly lower vertical movement rates are lower vulnerability. Land area change data are based on Barras and others (2008) data from 1956 to 2008 and are used as an alternative to shoreline change data for wetlands and salt marshes in Louisiana. Land loss rates are in square meters per kilometer per year (m2/km2/yr) and are derived from 13 classified Landsat Thematic Mapper satellite mosaics and 3 national wetland inventory habitat datasets over the last 50 years. Land-area change rates were calculated at 5-km intervals within the Louisiana coastal area (Barras and others, 2008). Ranked-land area change rates are shown in table 2. Calculating the index The coastal vulnerability index (CVI) calculated in this study is the same as that used in Thieler and Hammar-Klose (1999) and is similar to that used in Gornitz and others (1994), as well as to the sensitivity index employed by Shaw and others (1998). Once each section of coastline is assigned a ranked value for each specific data variable, the CVI is calculated as the square root of the product of the ranked variables divided by the total number of variables:
where, a = geomorphology, b = shoreline erosion/accretion rate (or land area loss), c = coastal slope, d =relative sea-level rise rate (or vertical movement rate), e = mean significant wave height, and f = tidal range. The calculated CVI value is then divided into four vulnerability categories , which are defined such that each interval is statistically different from the adjacent interval (that is, natural Jenks). This method of establishing vulnerability ranges is different from the quintile ranges established by Thieler and Hammar-Klose (2000b), and focuses on grouping similar values and maximizes the differences between vulnerability groups. The CVI ranges (low - very high) defined in this report apply specifically to the Northern Gulf of Mexico and are not comparable to CVI ranges in other areas where the CVI has been employed (that is, very high vulnerability means the same among regions, but the numeric values differ, such that a numeric value that equals very high vulnerability in one region may equal moderate vulnerability in another). To compare CVIs between regions, the national-scale studies should be used (Thieler and Hammar-Klose, 1999; 2000a; and 2000b). Principal component analysis The variables defining the CVI are not independent or random; therefore they do not contribute equally to the unweighted index. A principal component analysis (PCA) is utilized to reduce the dimensionality of the CVI data, illustrate the relationships that exist among variables, identify the relative importance of each variable, and help to understand variable importance along the coast. PCA is performed on the CVI, calculated such that five variables are held at the mean and one variable is allowed to change. This isolates individual variables and returns the contribution of each variable within a principal component. Eigenvectors and principal component loadings, which are coefficients of the equation that defines the eigenvector and corresponds to a variable, are then used to determine which variable or combination of variables is most influential to the index value, and which variables are least influential (appendix).
Table 1. Data sources from the original Gulf of Mexico CVI (Thieler and Hammar-Klose, 2000b) and the updated CVI for the Northern Gulf of Mexico presented here. Data sources with italic text and gray backgrounds were not used to calculate the updated CVI.
Table 2. Ranges for vulnerability ranking of variables along the Northern Gulf of Mexico Coast.
To view files in PDF format, download a free copy of Adobe Reader. |

![]() U.S. Department of the Interior |
U.S. Geological Survey
U.S. Department of the Interior |
U.S. Geological Survey
URL: https://pubsdata.usgs.gov/pubs/of/2010/1146/html/methods.html
Page Contact Information: Contact USGS
Page Last Modified: Wednesday, 07-Dec-2016 22:36:46 EST