U.S. Geological Survey Open-File Report 2010-1146
Coastal Vulnerability Assessment of the Northern Gulf of Mexico to Sea-Level Rise and Coastal Change
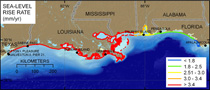
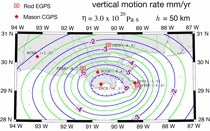
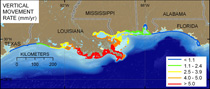
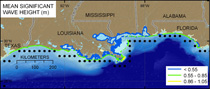
Relative sea-level change The relative sea-level change variable is derived from the change in annual mean water elevation over time as measured at tide gage stations along the coast. There are 16 tide gauges with records longer than 25 years between Key West, FL, and Port Isabel, TX (NOAA/NOS/CO-OPS, 2009; Zervas, 2001). The change in the rate of sea-level rise along the coast was estimated by gridding sea-level rise rates from these 16 tide stations using a linear interpolation method. Tide gauge data inherently include both eustatic sea-level change as well as regional sea-level change due to isostatic and tectonic adjustments of the land surface. Relative sea-level change data are a historical record and thus portray only the recent sea-level trend (<100 years). Relative sea-level change for the northern Gulf of Mexico falls within the very low (1.38 mm/yr at Apalachicola, FL) to very high vulnerability (9.65 mm/yr at Eugene Island, LA) category based on tide gauge data (fig. 7). Using the ranking scheme outlined in table 2 and that of Thieler and Hammar-Klose (2000b), 88 percent of the northern Gulf of Mexico falls within the very high vulnerability category with respect to sea-level rise. Vertical movement rate In addition to sea-level rise rates determined from tide gauge data, vertical movement rates have been estimated for the Northern Gulf of Mexico using GPS measurements, Holocene sediment thicknesses, and a viscoelastic Earth model (Ivins and others, 2007). These data suggest vertical movement rates, as a result of subsidence, to be between -1 and -6 mm/yr from Pensacola, FL, to Galveston, TX (fig. 8A and 8B). These data can be divided into categories in a similar way that the tide gauge SLR data are classified (table 2). The distribution of vertical movement rate may capture more of the variability in subsidence rates that exists across the study area as a result of sediment loading and compaction of the Mississippi Delta sediments than the relatively sparse water-level recorders are able to capture (that is, there are only 7 tide gauges with a record longer than 20 years from Apalachicola, FL, to Galveston, TX) (fig. 8B). In addition, Between the Grand Isle, LA, and Dauphin Island, AL tide gages, there is more than 6,000 km of shoreline (as measured using the GSHHS for this study) and more than 6-mm/yr difference in sea-level rise rate. The update from sea-level rise rate to vertical movement rate highlights important differences in relative sea-level change between the Mississippi Delta and the barrier coasts of Florida and Texas, and thus is chosen to replace the NOS tide gage data in the updated CVI determination. Using vertical movement rate data, 51 percent of the study area is very high vulnerability, as opposed to 88 percent when water-level recorders are the sea-level change data. Mean significant wave height Mean significant wave height is used here as a proxy for wave energy, which drives coastal sediment transport. Wave energy is directly related to wave height E = 1/8 ρgH2 where E is energy density, H is significant wave height, ρ is water density, and g is acceleration due to gravity. The ability to mobilize and transport coastal sediments is a function of wave height squared. Hindcast significant wave height data are available for the Gulf of Mexico using the U.S. Army Corps of Engineers Wave Information Study (WIS) (Hubertz and others, 1996). These data were gridded using an interpolation method to derive continuous wave height data for the open coast of the Gulf of Mexico. Mean significant wave heights in the Northern Gulf of Mexico ranged from greater than 0.7 m along the open Gulf of Mexico coast of Texas and Louisiana to 0.6 m along the Florida open Gulf coast. Wave heights within bays, lagoons, estuaries, and sheltered saltmarshes are less that 0.5 m (very low mean significant wave height vulnerability), and represented over 70 percent of the evaluated shoreline with respect to wave height (fig. 9). Tidal Range Tidal range is linked to both permanent and episodic inundation hazards. Tide range data were obtained from NOAA/NOS published benchmarks from the Gulf of Mexico. Mean tidal range is less than 1 m for all of the Northern Gulf of Mexico; therefore, the entire shoreline (100%) was classified as very high vulnerability (0 - 1.0 m) with respect to tidal range. |

![]() U.S. Department of the Interior |
U.S. Geological Survey
U.S. Department of the Interior |
U.S. Geological Survey
URL: https://pubsdata.usgs.gov/pubs/of/2010/1146/html/physicalvar.html
Page Contact Information: Contact USGS
Page Last Modified: Wednesday, 07-Dec-2016 22:36:46 EST