 |
Figure 1. Map of the Coastal Vulnerability Index (CVI) for the U.S. Gulf Coast as determined by Thieler and Hammar-Klose (2000b). The CVI shows the relative vulnerability of the coast to changes due to future rise in sea level. |
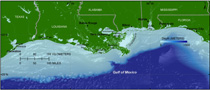 |
Figure 2. The Northern Gulf of Mexico study area, stretching from Galveston, TX, to just beyond Panama City, FL. |
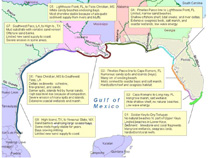 |
Figure 3. The eight geomorphic regions classified by A. Morang (written communication, January 11, 2010) for the Gulf of Mexico. Image courtesy of Andrew Morang, Engineer Research and Development Center, U.S. Army Corps of Engineers. |
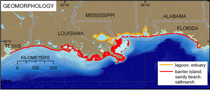 |
Figure 4.
Coastal geomorphology for the Northern Gulf of Mexico. The colored shoreline represents the variations in coastal geomorphology along the coast. The very high vulnerability geomorphology (red) includes barrier islands, saltmarshes, tidal flats, and sand beaches, whereas high- vulnerability areas (orange) include estuaries and lagoons. |
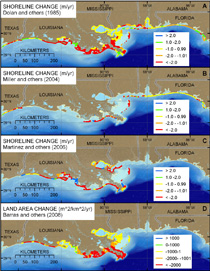 |
Figure 5. Shoreline change and land-area change datasets available within the Northern Gulf of Mexico study area. A, The Dolan and others (1985) dataset is the most comprehensive and the lowest resolution. It is displayed here as it was categorized by Thieler and Hammar-Kose (2000b). B, The Miller and others (2004) dataset is available for sandy beaches and barriers along the Gulf of Mexico at 50-meter intervals. C, The Martinez and others (2006) dataset is for the Gulf Coast of Louisiana. D, The Barras and others (2008) land-area change data are for Louisiana barriers as well as marsh areas. |
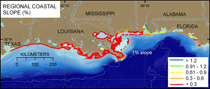 |
Figure 6. Regional coastal slope for the Northern Gulf of Mexico. The colored shoreline represents the regional slope of the land in a 10-km radius of the shoreline. Very low vulnerability slope areas are along Mobile Bay. Coastal slopes become gentler away from Mobile Bay and thus higher in vulnerability with respect to the Coastal Vulnerability Index ranking scheme (table 2). |
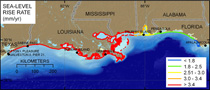 |
Figure 7. Relative sea-level change rate along the Northern Gulf of Mexico. Eight of the 16 tide gage locations along the U.S. Gulf of Mexico coast fall within the study area and are indicated by black dots. |
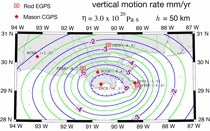 |
Figure 8A. Vertical movement rate along the Northern Gulf of Mexico (after Ivins and others, 2007). The red dots and x's represent GPS locations. |
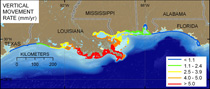 |
Figure 8B.
Vertical movement rate along the Northern Gulf of Mexico divided into quintiles for Coastal Vulnerability Index variable ranking (table 2). |
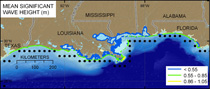 |
Figure 9. Mean significant wave height (meters) along the Northern Gulf of Mexico. The black dots indicate the locations of WIS (Wave Information Studies) wave stations (Hubertz and others, 1996). |
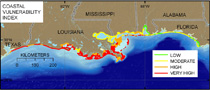 |
Figure 10. Northern Gulf of Mexico Coastal Vulnerability Index calculated using Dolan and others (1985) shoreline change data and sea-level rise rate from NOS/NOAA water-level gages. |
 |
Figure 11. Updated data source Coastal Vulnerability Index calculated using Miller and others (2004), and Martinez and others (2006) shoreline change data, Barras and others (2008) land-area change data, and vertical movement data from Ivins and others (2007). |
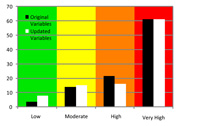 |
Figure 12. Histogram of percentage of shoreline in each vulnerability category for the two Coastal Vulnerability Index scenarios. |

