|
WRIR 99-4079: Estimates of Ground-Water Discharge as Determined from Measurements of Evapotranspiration, Ash Meadows Area, Nye County, Nevada |
||
|
|
|
|
An estimate of ground water annually discharging at Ash Meadows from the regional ground-water flow system, or more specifically from the regional carbonate aquifer, is computed directly from an estimate of the mean annual ET. This approach, as applied in this study, assumes that all ground water discharged from the regional ground-water flow system is evaporated or transpired locally from within the seven ET units identified as areas of substantial ground-water ET (pl. 1). Although springflow is not directly accounted for in the approach, it is considered part of the ET component on the assumption that it is evaporated or recycled back into the shallow ground-water flow system where, eventually, it is evaporated or transpired. As estimated, annual ET includes any precipitation falling on the local area that is evaporated, or that recharges the shallow ground-water flow system and later is evaporated or transpired. The estimate also may include some component of upward leakage (diffuse upflow) from the regional carbonate-rock aquifer. Annual ET is adjusted to remove any water contributed by local precipitation prior to computing ground-water discharge.
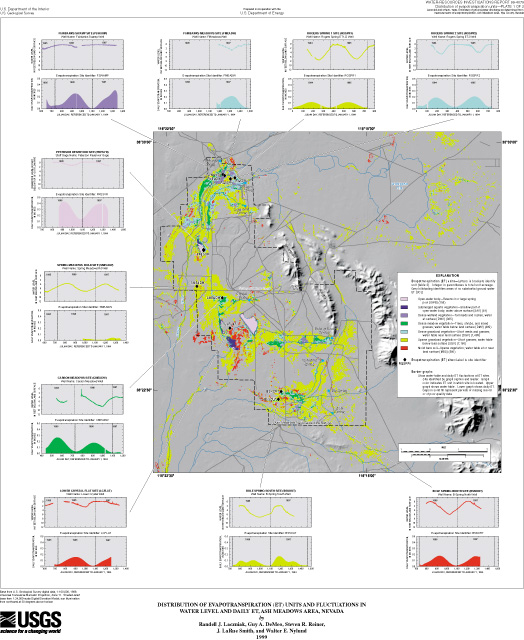
Estimates of mean annual ET (in feet and acre-feet) are given in table 10 for each ET unit. Estimates are based on rates calculated from micrometeorological data measured at 10 ET sites (table 7, fig. 13, and pl. 1). A unit having only a single ET site within its boundary is assumed to have an ET rate equal to that of the lone site. The ET rate for a unit having two sites within its boundary is assumed to be the average of the two sites. The rate for the one unit having three sites within its boundary, SGV, is assumed to be a weighted average of the three sites, where the weighting factor was the percentage of area within the unit best reflecting the character of the vegetation and soil conditions observed at the site. Percentages were determined using vegetation indices (Qi and others, 1994) computed from the June TM imagery. Because SAV is dominated by open water, its mean annual rate is assumed to be equivalent to that of open water (OWB). An estimate of the mean annual volumetric ET (in acre-feet) for each ET unit is computed as the product of a unit's total acreage and mean annual ET (in feet). Estimates range from 690 acre-ft for SAV to 9,300 acre-ft for SGV. The mean annual volumetric ET from Ash Meadows is estimated at 21,000 acre-ft (table 10) and was computed by summing the individual ET-unit estimates.
Mean annual ground-water discharge from the Ash Meadows area was computed directly from estimates of ET. The computation adjusted the estimated ET rates for each ET unit by removing the local precipitation component. The remaining ET is assumed to be that derived from ground water. Ground-water discharge is estimated by summing adjusted volumetric ET computed for each ET unit as the product of adjusted ET rate and acreage. Different adjustments were applied to account for the uncertainty in (1) the estimate of mean annual precipitation at Ash Meadows, and (2) the percentage of local precipitation included in the computed ET estimate. Although no long-term precipitation data are available for Ash Meadows, a reasonable estimate for mean annual precipitation is between 2.5 and 4.25 inches. This range accounts for differences observed during 3 years of local data collection (volumetric rainfall measurements, fig. 16), long-term record available from four National Weather Service stations in the general area (fig. 16), published maps of precipitation (Hardman, 1965; Winograd and Thordarson, 1975, fig. 3; Houghton and others, 1975, fig. 40), and a map generated by PRISM (parameter-elevation regressions on independent slopes model; Daly and others, 1994).
Three discharge estimates are given in table 11. Each discharge estimate represents a different precipitation adjustment. Estimates were computed with precipitation adjustments of 0, 2.5, and 4.25 inches and range from 18,000 to 21,000 acre-ft. A zero adjustment assumes that ET rates computed from micrometeorological data include no component of precipitation. The 4.25-inch adjustment assumes a high mean annual estimate of precipitation and that all precipitation is included in computed ET rates. The 2.5-inch adjustment represents any one of several of possible scenarios. One scenario would be where mean annual precipitation is 2.5 inches and all precipitation is included in computed ET rates. Another scenario would be where mean annual precipitation is greater than 2.5 inches, but only some portion of the precipitation is included in computed ET rates. The difference between the highest (zero adjustment) and the lowest (4.5-inch adjustment) estimate of ground-water discharge is about 3,000 acre-ft.
As applied, the precipitation adjustment assumes that the only sources for water being evapotranspired from within the seven classified ET units (areas of substantial ground-water evapotranspiration) are the regional ground-water flow system and rain falling directly on a unit's surface. Although the assumption discounts any water originating from the local infiltration of surface runoff or from precipitation falling on the surface of areas of no substantial ground-water ET (unclassified ET unit) as a potential source, it is considered reasonable in that (1) the water table beneath classified ET units is locally mounded indicating an outward component of ground-water flow, and (2) the limited vertical relief within the general area, the fractured nature of the few lower-lying carbonate-rock ridges, and the low and infrequent rainfall minimize occurrences of surface runoff.
Estimates of mean annual ET and of ground-water discharge (tables 10 and 11) differ some from other estimates reported for the Ash Meadows area. A mean annual ET estimate of 21,000 acre-ft (table 11) falls near the middle of the range defined by previous investigations--11,000 acre-ft (Walker and Eakin, 1963, p. 24; Winograd and Thordarson, 1975, p. 84) to about 35,500 acre-ft (D'Agnese and others, 1997, p. 46). As reported here, annual ET estimates include the Amargosa Flat area (fig. 3). Discrepancies with prior estimates are likely the result of differences in estimates of ET acreage, ET rates, or both. Earlier studies were of a regional scope and had limited data defining local ET rates. Thus, these previous studies applied ET rates for equivalent or similar phreatophytes found elsewhere in the western United States and relied on more general methods for delineating ET acreage. Although the accuracy of one method over another is difficult to evaluate, the more local and rigorous nature of the techniques used in this study suggest a more accurate quantification of ET acreage and rates for the Ash Meadows area.
Most previous estimates of ground-water discharge from the Ash Meadows area are based on measurements of springflow (Winograd and Thordarson, 1975, p. 84). Total springflow from Ash Meadows is estimated to be between 16,500 and 17,500 acre-ft/yr (Walker and Eakin, 1963, p. 24; Dudley and Larson, 1976, p. 12). This range does not include water potentially discharging from Amargosa Flat area (fig. 3). However, Winograd and Thordarson (1975, p. 84) calculated the upper limit of annual upward flow from the regional carbonate-rock aquifer into the shallow valley-fill aquifer at Amargosa Flat to be less than 1,000 acre-ft. Assuming that discharge from Amargosa Flat is 1,000 acre-ft (equal to the upper limit of upflow from the regional carbonate aquifer) and adding this quantity to the range estimated for springflow from Ash Meadows proper, total ground-water discharge from the Ash Meadows area would be between 17,500 and 18,500 acre-ft annually. This range is slightly less than that estimated by this study (18,000 to 21,000 acre-ft, table 11). The small difference could be the result of errors in springflow or ET measurements, or could be related to erroneous assumptions in the ET-based method. However, if both estimates are assumed correct, then this difference must be attributed to a source other than springflow that provides water to the shallow valley-fill aquifer. The sources likely to be contributing additional water are diffuse upflow from the regional carbonate-rock aquifer, discharge from subsurface seeps, or some combination thereof.
The accuracy of the estimate of ground-water discharge is limited by the assumptions inherent in the classification procedure and the energy-budget methods (primarily Bowen ratio) used to compute daily ET. Other limitations include (1) the assumption that all springflow is ultimately evaporated or transpired from within the bounds of one of the delineated ET units; (2) the short-term nature of the data used to compute mean values; (3) the limited number of sites used to estimate ET from each ET unit; and (4) the uncertainty in the adjustment applied to remove precipitation from ET estimates. The mean annual ET estimate of each ET unit (table 10) was computed from data acquired at three or fewer sites for periods of 2 or less years. The estimate of mean annual precipitation is based on only 3 years of local precipitation measurements. Although the period of data collection did not include an extremely abnormal year, some variation in the annual ET rates was noted from one year to the next and between sites within the same ET unit. ET estimates determined from longer term data and additional ET-site installations would help refine, improve, and provide more confidence in any estimate of mean annual ground-water discharge.
ET-unit acreage was delineated on the basis of TM imagery acquired in 1992. Precipitation data reported for nearby weather stations (fig. 16) indicate that rainfall for 1992 was above normal. To some extent, the above-normal precipitation served as the motivation for selecting 1992 imagery as the means from which to delineate areas of substantial ground-water ET. Years with above-normal precipitation are expected to yield healthier vegetation and moister soils--conditions consistent with easier discrimination by spectral methods. Changes in precipitation have an obvious effect on the vigor and extent of the vegetation, the soil-moisture conditions, and the depth to the water table--all of which effect ET rates. Classifying ET units on the basis of multiple years of imagery would produce acreage estimates more representative of the long-term average.
The procedure classified 10,352 acres of Ash Meadows as an area from which ground water is being lost by evapotranspiration (table 10). The remaining part of Ash Meadows, comprising nearly 40,000 acres, is assumed to be an area of no substantial ground-water loss. This assumption, although strongly supported by the lack of vegetation, dryness of soil, and greater depths to the water table (generally exceeding 15 ft), could result in some error in the estimate of ground-water discharge. Even though ET rates are likely to be small, volumetric losses could be substantial considering the extensive size of area.
The procedure does not identify the open playa of Amargosa Flat (fig. 3) as an area of substantial ground-water ET, but because ground water flows upward from the regional carbonate-rock aquifer into the shallow water table aquifer in this area (Winograd and Thordarson, 1975, p. 84), evaporation of ground water is plausible. The exclusion of the playa acreage from computations of ground-water discharge is presumed reasonable considering the relatively thick low-permeability strata making up the playa sediment and the relatively deep water table (typically more than 15 ft; Kilroy, 1991, fig. 4).
The estimates of ground-water discharge given in table 11 include only water lost through evaporation and transpiration, and do not include any water that may be leaving the Ash Meadows area through subsurface means. Lateral gradients based on two-dimensional configurations of the regional water table (Dudley and Larson, 1976; Kilroy, 1991) indicate a southwest direction of ground-water flow from Ash Meadows into the south-central Amargosa Desert (fig. 2). No rigorous estimates of subsurface outflow into the south-central Amargosa Desert exist within the current literature. Existing estimates are based on regional investigations or on results from regional flow models and range from near zero to a few thousand acre-feet annually (Bateman and others, 1974, p. 5; Czarnecki and Waddell, 1984, table 1; Prudic and others, 1995, p. 62; International Technology Corp., 1997). Until additional data defining water-level distributions and spatial variations in the hydraulic properties controlling ground-water movement throughout the valley-fill and regional carbonate-rock aquifers in south-central Amargosa Desert become available, reliable estimates of subsurface outflow are not possible. Considering the potential for some subsurface outflow and for some ground-water ET from the open playa of Amargosa Flat, the range given for annual ground-water discharge, 18,000 acre-ft to 21,000 acre-ft, should be taken as a minimum estimate of the total ground-water loss from Ash Meadows.
|
|
|