README FOR MOVIES
Home page | Table of contents | Glossary | Geology | Depositional model | Heterogeneity | Diagenetic history | Petroleum geology | 1) East-West porosity slices | 2) North-South porosity slices | 3) Onion views of 3-D images | 4) Horizontal slices of porosity | 5) Horizontal and East-West permeability and porosity slices | Technical information
QuickTime software of Apple Corporation is required to view the movies. Also needed is movie player software, most of which is freeware or shareware. Try searching the WWW using "movie+software" . The current WWW site for information on Apple QuickTime freeware is http://quicktime.apple.com. QuickTime and MoviePlayer software for Macintosh computers and PC/Windows computers can be downloaded from links at http:/www.apple.com, or can be copied using File Transfer Protocol (ftp) with the following command: ftp ftp.support.apple.com . Unfortunately, this anonymous-user ftp site has a small quota, even with an additional ftptoo.support.apple.com site. Because of a limited number of seats, we don't recommend accessing the site during business hours.
Movies can be called up from the text, but access is much quicker directly from the movies folder. Should you have trouble displaying images, try increasing available memory by closing all unnecessary windows and software programs. Shrinking the size of the movies may also aid in their display. We recommend playing with the menu bar located at the top of the movies and the bounding scroll bars; both to improve the image display and to familiarize yourself with program capabilities, including print and file export.
The six movies located in the "movies" folder display 3-D distribution and volumes of porosity and permeability for the Upper Cretaceous age Sussex "B" sandstone across the southern two-thirds of the House Creek oil field, Powder River Basin, eastern Wyoming. Information on data sources, and technical and research methodology are in the techinfo.htm file located in the "ssx_txt" directory. A glossary is included (glossary.htm) in the "ssx_txt" subdirectory for definitions of computer and geologic terms.
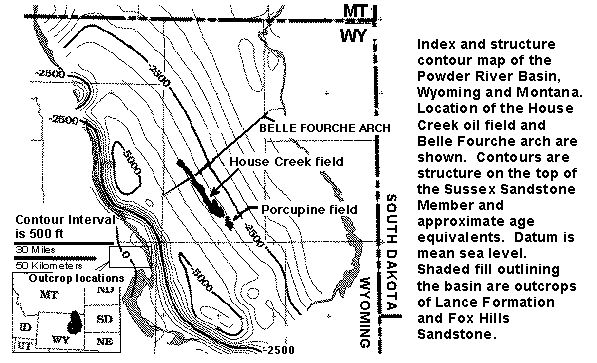
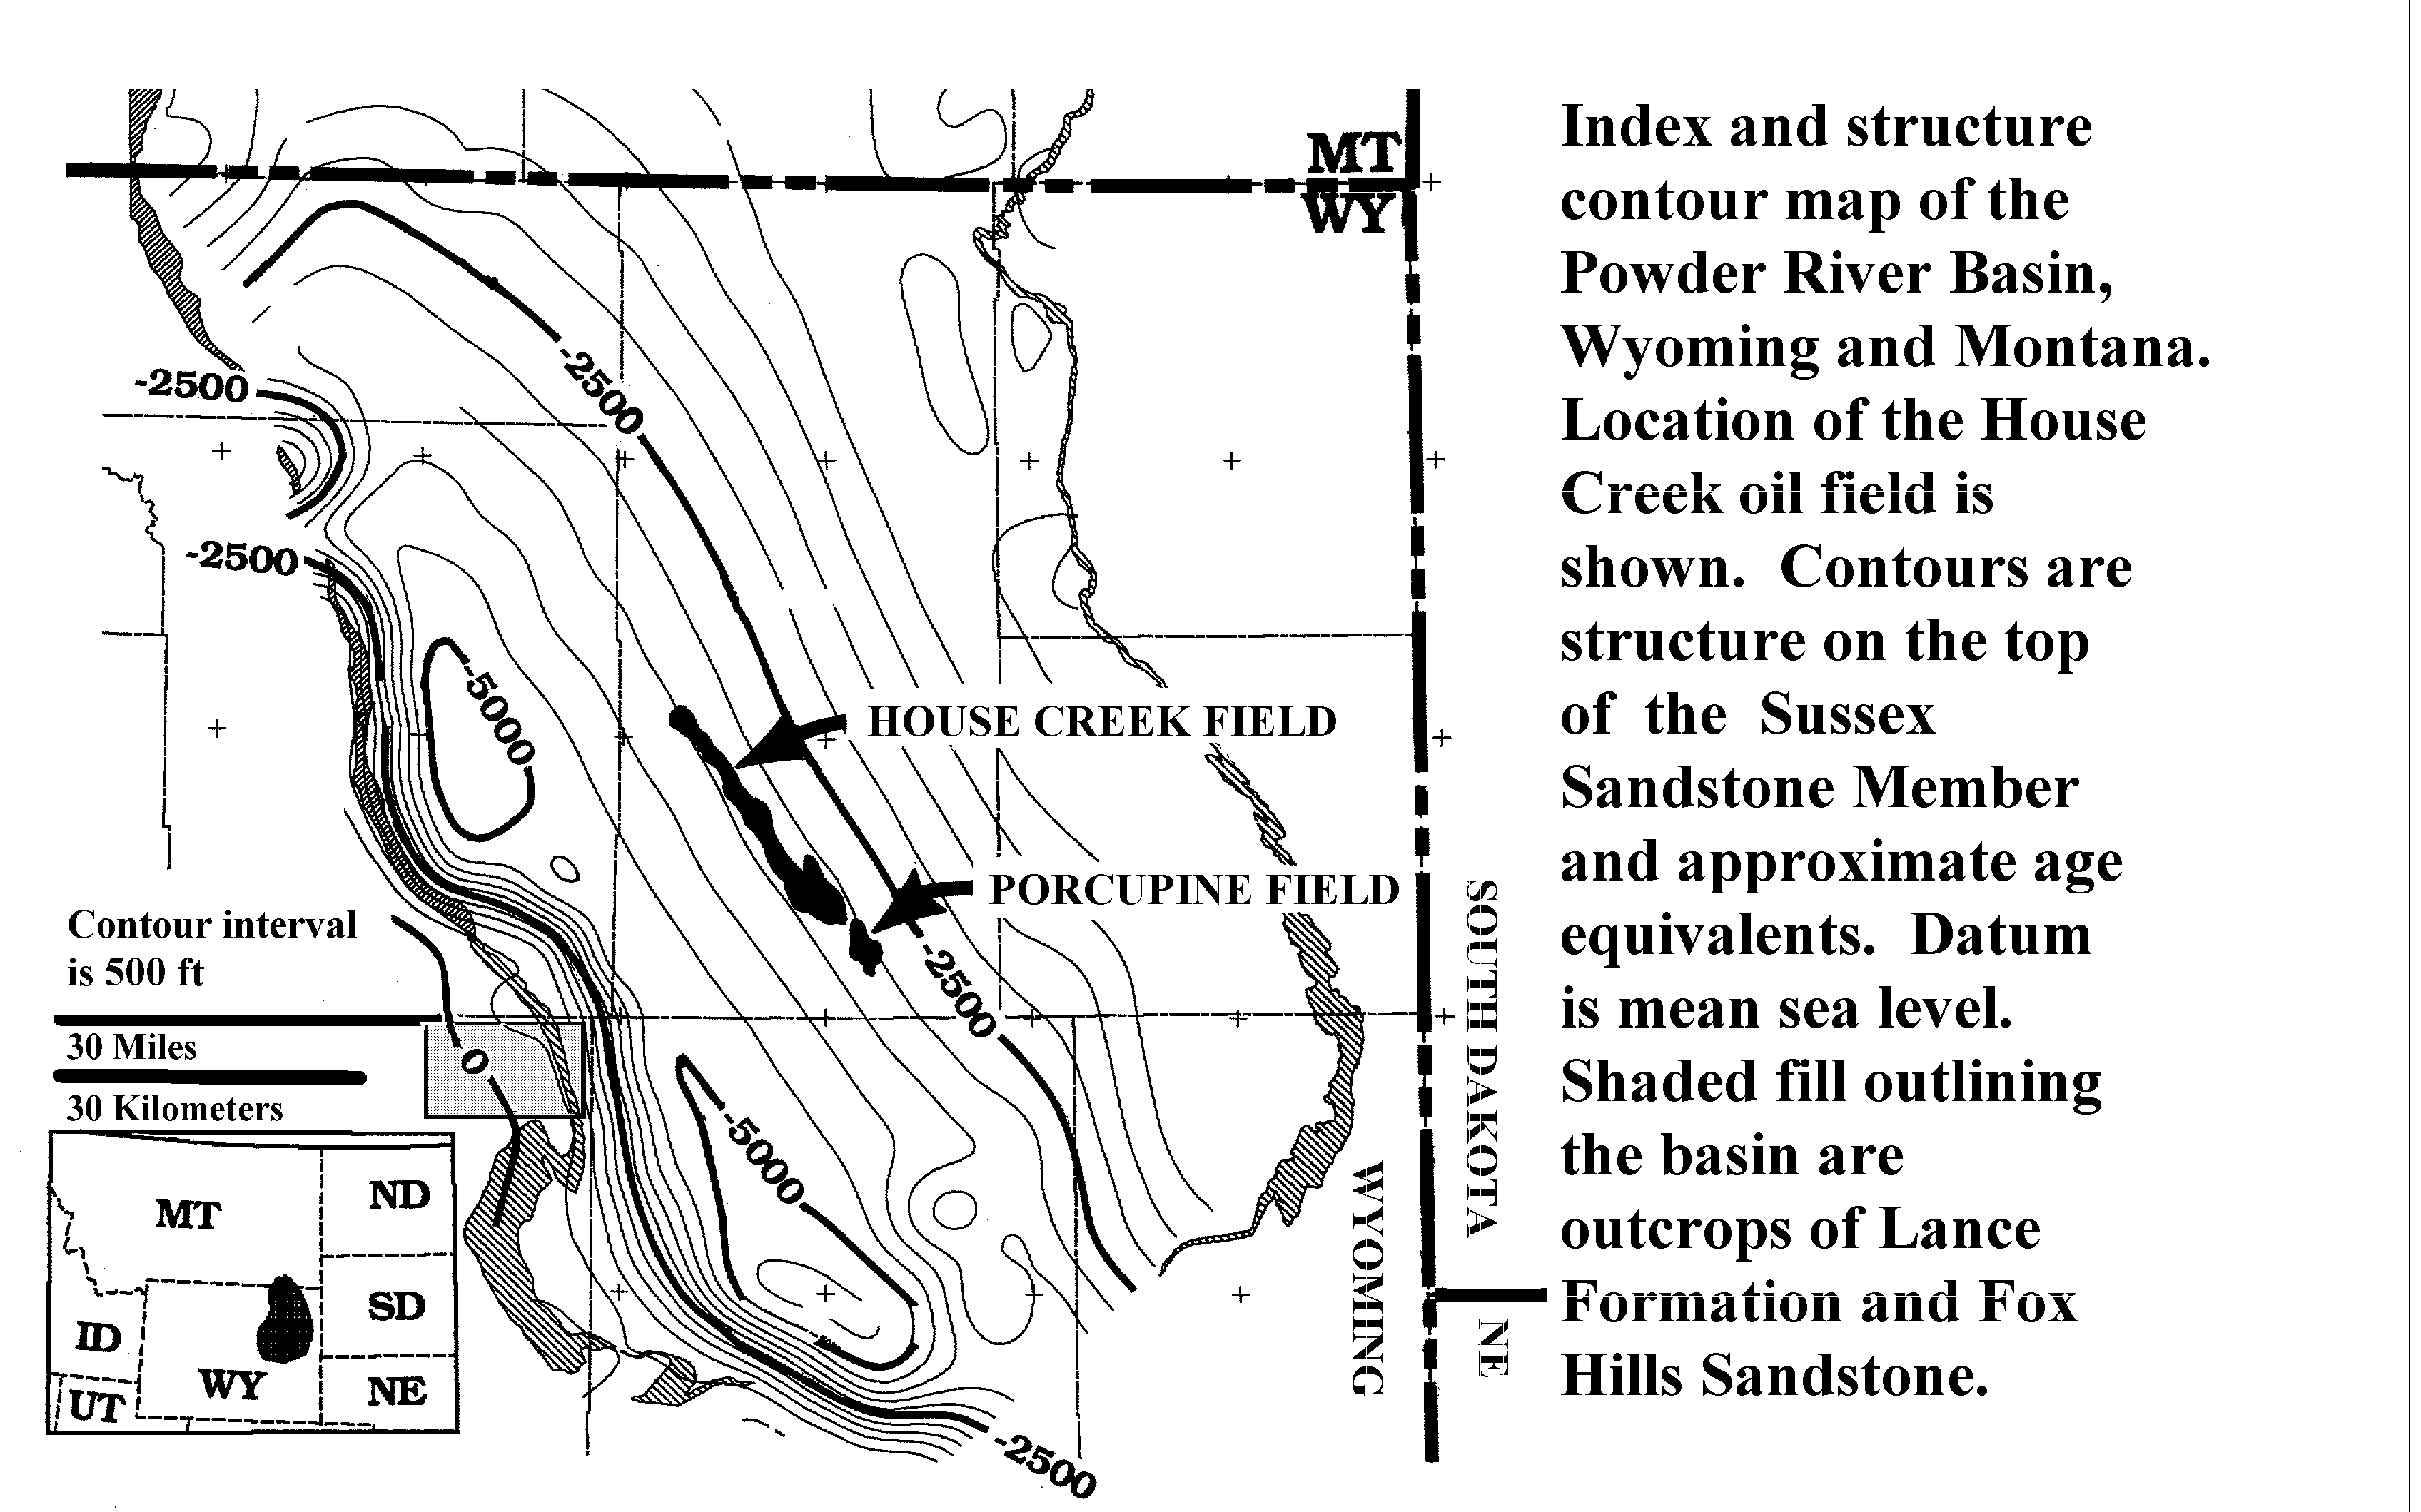
Figure 1. Structure contour map on the top of the Upper Cretaceous Sussex Sandstone Member of the Cody Shale, and approximate age equivalents, Powder River Basin, Wyoming and Montana. Location of the House Creek field is shown. Areal extent of the Sussex "B" sandstones is delineated by black-colored fields. Shaded fill outlining the basin are outcrops of Lance Formation and Fox Hills Sandstone. The rectangle located next to the 30-miles scale bar defines the area of studied outcrops of the Sussex and Shannon Members, much of the Salt Creek anticline, and the towns of Midwest and Edgerton. Contour interval is 500 ft. Datum is mean sea level. A detailed (176 KB) version is named indexfig.gif.
Vertical exaggeration of the 3-D images ranges from 20 to 60 times. The Sussex "B" sandstone is less than 60 ft (18 m) thick and would look like a razor's edge without the exaggeration. The House Creek oil field is about 1 mi (1.6 km) wide and, combined with the small Porcupine field at the southern boundary, is about 36 mi (58 km) long. Reservoir-grade intervals in images are shown on the porosity (left) color bar by green through red (8 to 21 percent porosity); low-porosity non-reservoir intervals are purple and blue (1 to 8 percent porosity). Movies show:
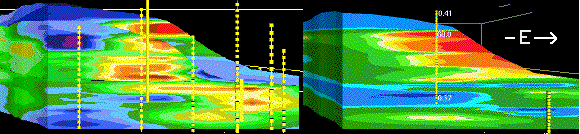
Figure 20. East-west oriented vertical slices of porosity (left, percent) and permeability (right, mD). This image (porpermv.gif) shows the highly variable porosity (left) and permeability (right) using core data. Porosity values/colors are reservoir grade (green through red) of 8 through 21 percent, and below-reservoir-grade low-porosity (blue) of less than 8 percent. Permeability ranges are: purple and blue, up to 5 mD; green, 5 to 16 mD; and yellow through red are greater than 16 mD. Average permeability of Sussex "B" reservoir sandstones is 15 mD. The close-spaced 3-D grid essentially treats each well as a separate set of points for the purpose of showing the variation in porosity and permeability. The various diamond shapes and streaks of low through high porosity and permeability illustrate the interbedding of thin beds of reservoir- and non-reservoir-grade sandstone and mudstone. These diagrams include the eastward and upward increases in porosity and permeability, and stacking of sand ridges shown in previous images. This slice is located in the northwestern half of the field. Yellow dots are (left) core and well-log and (right) core sample locations. Slices are 1.8 mi (2.8 km) wide and 50 ft (15 m) high. Vertical exaggeration is 30x. Respective names of the east-west porosity and permeability slide-image files are 3dew_img.htm and 3dvk_img.htm .
Individual GIF files used to generate the movies are stored in the below directories (bounded by parentheses); GIF files are displayed in the text portion of this publication as single images, and as slide shows using an external viewer, such as JPEGView and LView.
All movies are stored in the movies directory;