DDS 69-Q: Areas of Historical Oil and Gas Exploration and Production in the United States
IntroductionBy Laura R.H. Biewick
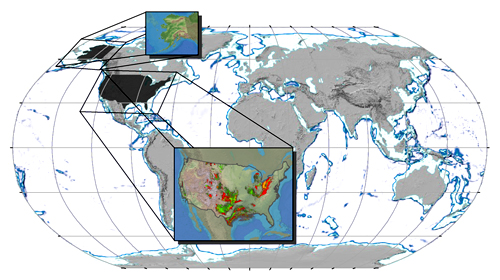
The U.S. Geological Survey (USGS) map of historical oil and gas exploration and production in the United States displays present and past oil and gas production, as well as the location and intensity of exploratory drilling outside producing areas. This map compilation is an updated version of the USGS map that was published by Mast and others (1998). In addition to a hardcopy map, the data were refined and made more accessible using Geographic Information System (GIS) tools. For this digital map product:
Digital data were used from the more than 3 million wells in IHS Energy, Inc.'s PI/Dwights PLUS Well Data on CD-ROM (IHS Energy Group, 2005). In some areas, the IHS data tend not to be complete, particularly for pre-1920 production. IHS data was supplemented with state wells databases for Indiana, Pennsylvania, Kentucky, Illinois, and Ohio (current as of 2004 to 2006). Because of the proprietary nature of many of these databases, exact drill hole locations cannot be shown. Therefore, the mapped area was divided into a grid of cells one-quarter square mile and the well production status was aggregated. Each cell is attributed to indicate wells within the cell as predominantly oil-producing, gas-producing, both oil- and gas-producing, or the wells are dry or their production status is unknown. A cell has an attribute value of 1 (green) for oil, if it contains at least one productive oil well, but no productive gas wells; a cell that contains at least one productive gas well, but no productive oil wells, has an attribute value of 2 (red), for gas; cells that contain at least one productive oil well and at least one productive gas well or one well producing both oil and gas, have an attribute value of 3 (gold), for both oil and gas. When the type of production of the wells located within the cell is unknown, or the cell contains no producing wells, the cell has an attribute value of 4 (charcoal), for dry or unknown. No proprietary data are displayed or included in the cell maps. The cell attributes also contain the latitude and longitude value of the center of each cell. Maps are available both as a static Portable Document Format (PDF) file, and as an interactive map that is accessible at the USGS Energy Program website. A geodatabase was constructed for spatial analysis of energy resource data essential for land use and energy decision-making. GIS spatial data can be accessed from the internet map service via a web browser and imported into ArcGIS (ESRI, 2005). The interactive map allows the user to: (1) select visible layers of interest, (2) zoom and pan, (3) identify features, and (4) print custom maps. By including USGS National Map services for base cartographic data, the interactive map is designed so that appropriate reference data can be displayed at various scales. The amount and detail of oil and gas exploration and production data varies with scale for optimum performance. The interactive map organizes and consolidates into one map document all of the data layers that make up the static PDF map. An important aspect of this map product is that its use does not require extensive GIS expertise or highly specialized equipment. Software used to create this digital map product include: Environmental Systems Research Institute, Inc. (ESRI) ArcGIS 9x, Python, Adobe Photoshop CS, Illustrator CS, and Acrobat 7.0. Acknowledgments The IHS Energy well data used to create exploration cells were consolidated into a "oneline" file created by Craig J. Wandrey (USGS) containing all of the oil and gas wells in the United States. Thanks are extended for simplifying access to the IHS Energy, Inc. data through use of this oneline file. The USGS IT professionals who administer our computer systems and databases make it possible for us to provide GIS analysis over the internet. This product would not be possible without the contributions of Gregory L. Gunther and Christopher C. Skinner for internet GIS architecture and design, and with James D. Brewton, Sean Strickland and David A. Ferderer for their committment to serving USGS energy resource data. Thanks are also extended to Lymon S. Cazenave for his expertise in assembling the video clip "Oil and Gas Exploration and Production Through Time". Disclosure Statement Although these data have been processed successfully on a computer system at the U.S. Geological Survey, no warranty expressed or implied is made regarding the display or utility of the data on any other system, or for general or scientific purposes, nor shall the act of distribution constitute any such warranty. The U.S. Geological Survey shall not be held liable for improper or incorrect use of the data described and/or contained herein. Any use of trade, product, or firm names is for descriptive purposes only and does not imply endorsement by the U.S. Government. Although this information product, for the most part, is in the public domain, it also contains copyrighted materials as noted in the text. Permission to reproduce copyrighted items for other than personal use must be secured from the copyright owner. |