


Error Analysis
|
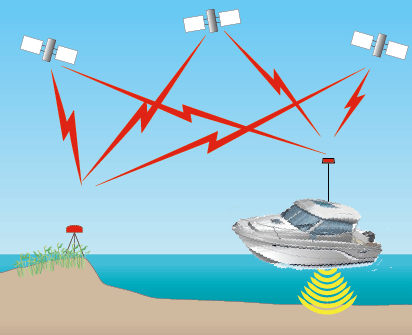
Sonar Accuracies The survey used three sonar systems mounted on a 17-ft outboard motor boat (designated "Mako") and two jet skis (designated "WVR1" and "WVR2"). Errors in the data from the three sonar sensors were evaluated by comparing sea floor elevation differences at track line crossings or along repeated track lines. Recorded depths within a 1-meter-diameter radius of each track line intersection were analyzed for differences. In theory, the values at a crossing point should be the same and any deviation represents errors due to system noise and possible biases if the systems are not properly calibrated. This technique only evaluates the relative accuracy of the survey, because all measurements are relative to the reference station coordinates and assumes no bias with the reference station itself. This crossing analysis (table 1) shows that the jet skis were self-consistent (Note: the Mako did not cross itself). A small, 2 cm, bias was detected between the jet skis and larger, 9 cm and 11 cm, biases between the Mako and WVR1 and WVR2, respectively. Using mean differences (mz) from this analysis, a bias correction was applied to WVR1 and the Mako data. After the bias correction, the crossing analysis revealed that the vertical accuracy of the soundings, calculated as the mean absolute difference (sz), was 7 cm. The estimated horizontal accuracy derived from the GPS precise trajectory data and the reference station coordinates was 4 cm Root Mean Squared (RMS).
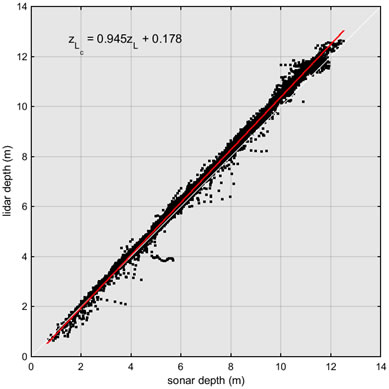
Table 1. Sonar track line crossing differences before corrections were applied. Lidar Accuracies To assess the vertical accuracy of the lidar bathymetry, the sonar and lidar data were interpolated to the planned sonar survey track lines. Offsets from the historical datasets can be calculated in the same way such that all data are treated in an objective way, regardless of differences in sampling density and patterns. Using the sonar data as “ground-truth” for the lidar data, the lidar depths were compared to the sonar depths (fig. 9) and a small (<10 percent) depth-dependent bias was detected. This bias resulted in a mean offset of 0.27 cm and a RMS difference of 0.35 m. A bias correction was applied to the lidar data using a linear model that included a gain correction (0.944 times the sampled lidar depth) and an offset correction (0.172 m). The corrected lidar data are presented in this report. The estimated horizontal and vertical accuracy of the corrected lidar data is 9 cm and 17 cm RMS, respectively.
Figure 9. Comparison of lidar and sonar depths showing depth-dependent bias of the lidar data. Any use of trade, firm, or product names is for descriptive purposes only and does not imply endorsement by the U.S. Government. |
||||||||||||||||||||||||||||