


Data Processing
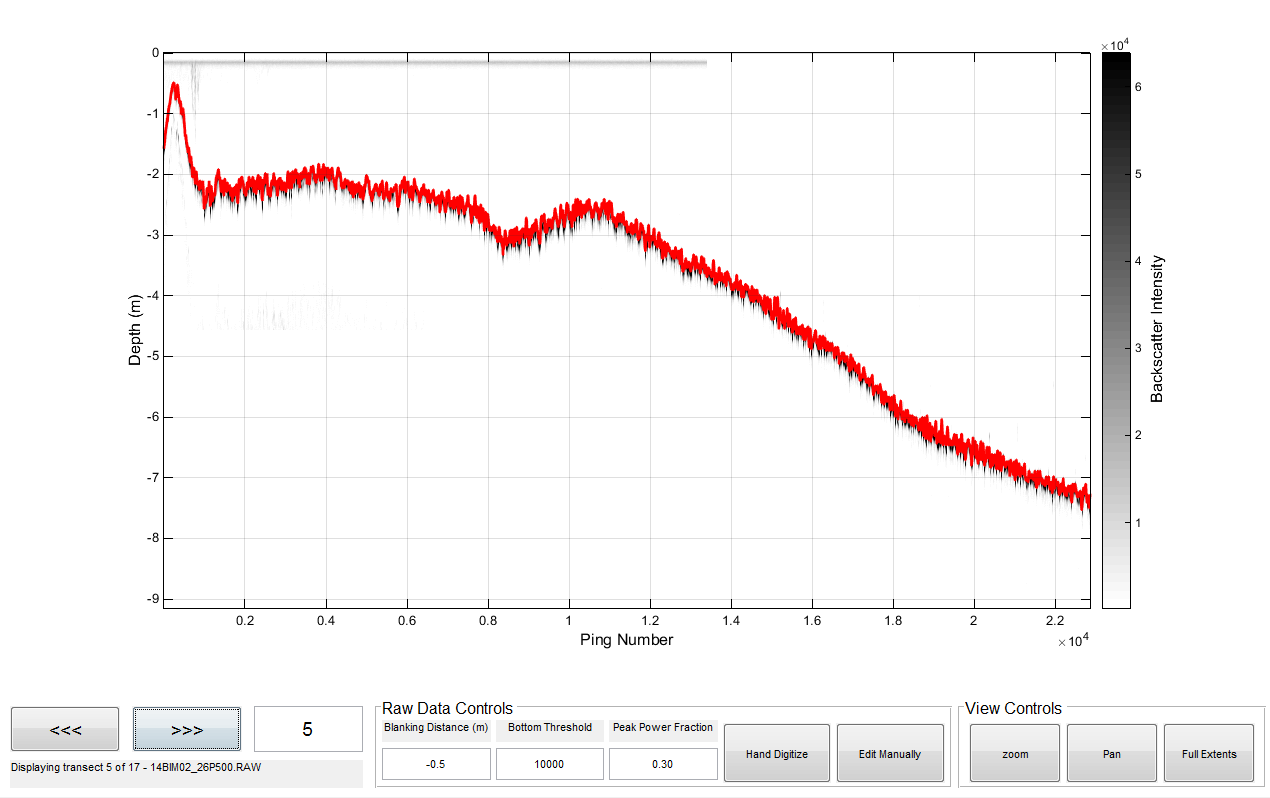
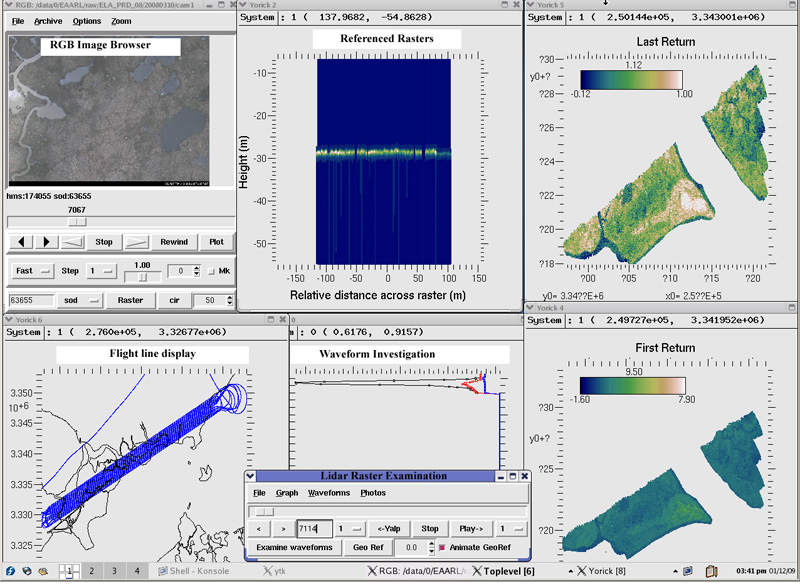
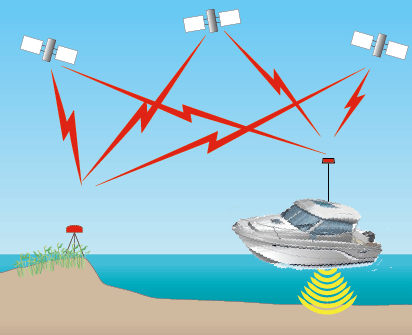
 Figure 6. Vertical reference components (dE=ellipsoid to GPS antenna, dS=antenna offset height, dB=depth to sea bed). [Click to enlarge] Horizontal and vertical data acquired by the sonar and lidar systems are referenced to the earth-centered coordinate system WGS84. Earth-centered systems reference all points of the earth's surface relative to a theoretical centroid of the earth. Vertical positions referenced to earth-centered systems are referred to as ellipsoid heights. Using earth-centered reference systems for the vertical component eliminates the need to reference bathymetric data to water level, that is, tide gages. Earth centered reference ellipsoid height is more accurate than a water level datum and is globally applicable. Converting to a water-level-based datum (MLW, MLLW) can be accomplished by using tools such as NGS GEOID12a and VDATUM. Figure 6 illustrates the relation of the ellipsoid to boat depth soundings, and is similar for lidar laser shots. Trajectory ProcessingPrecise boat and aircraft trajectories were determined using differential GPS data and Novatel/Waypoint GrafNav© software. GrafNav© calculates the relative position of the survey platform receiver to the base receiver. Thus, all trajectories are relative to the reference station position. A single output file of precise trajectory and quality control information at 0.1 second intervals was produced for each survey day and for each survey platform. The output provides precise position measurements that are time stamped with GPS time, thus allowing the GPS data to be merged with the boat and aircraft sensor data. Bathymetric ProcessingPost-processing of sonar data is accomplished using custom-built USGS software written in Matlab©code (fig. 7). The processing software is used to edit erroneous sounding data, synchronize the precise boat GPS trajectory with sonar data, and apply geometric corrections using the recorded pitch and roll measurements. The final processing step creates seafloor elevations by merging the measured distance from the ellipsoid to the GPS antenna phase center "dE", corrected GPS/transducer staff height "dS", and corrected distance from the transducer to the sea-floor "dB" (fig. 6). Thus, final elevations are relative to the ellipsoid (WGS84) and can then be converted to orthometric height or the North American Vertical Datum 1988 (NAVD88) using NGS GEOID12a geoid separation software. Lidar ProcessingPost-processing of EAARL-B data is accomplished using a custom-built USGS Airborne Lidar Processing System [ALPS], (Nayegandhi and others, 2009) that combines laser return backscatter digitized at 1-nanosecond intervals with aircraft positioning data derived from the IMU and GPS receivers. The ALPS software enables the exploration and processing of lidar waveforms and the creation of Digital Elevation Models (DEMs) for bare-Earth, canopy-top, submerged topography and vegetation canopy structure (fig. 8). ALPS is used to detect the first return from the water (or land) surface as well as to find a last return corresponding to the sea floor. In submerged environments, effects of refraction and change in speed of light as it enters the water column are accounted for in the “submerged topography” algorithm (Bonisteel and others, 2009). The lidar data were reviewed manually and data that obviously did not penetrate to the sea floor were removed. Like the sonar system, "dE", "dS", "dB" are computed, making the final elevations of the submerged topography relative to the ellipsoid (WGS84). Ellipsoid height can then be converted to orthometric height or NAVD88 using NGS GEOID12a geoid separation software.
Any use of trade, firm, or product names is for descriptive purposes only and does not imply endorsement by the U.S. Government. |
||