Data Series 995
The maps below show the division of the flight into smaller areas and division of the flight path in each area into 5-minute (time) segments. Alternating purple and yellow lines represent each segment. Pages containing thumbnail images of the photographs, referred to as contact sheets, were created based on these segments. Click on each segment name to access the associated contact sheet. Refer to Table 1 for a list of images, latitude and longitude, and date and time, arranged by contact sheet.
Segment names are labeled with the following filename format: yyyy_mmdd_hhmmss, where yyyy denotes the year, mmdd denotes the month and day, and hhmmss denotes the start time in hours, minutes and seconds of the 5-minute segment of time during which those photographs were taken. All times refer to Coordinated Universal Time (UTC). For example, segment 2015_1007_164000 was taken October 7-9, 2015, starting at 16:40:00 UTC. An effort was made to set the camera's internal clock to within 1 second of UTC at the beginning of the flight.
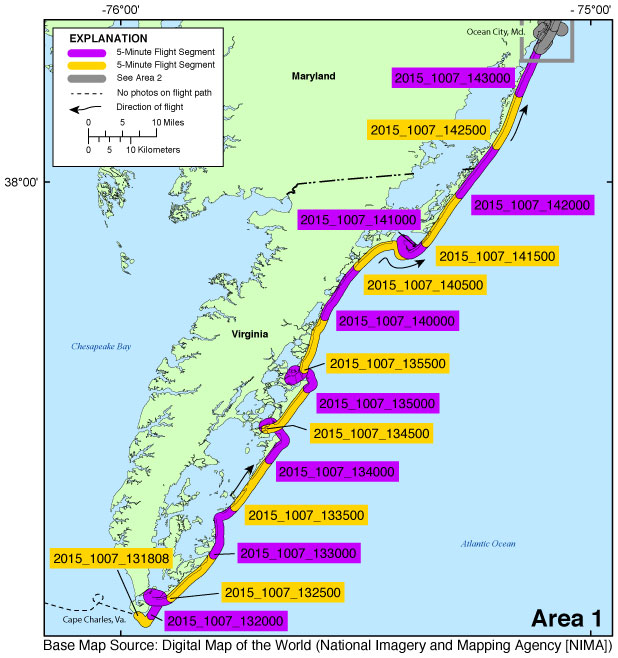
Figure 3A. Area 1—Cape Charles, Virginia, to Ocean City, Maryland. Map showing the post-Hurricane Joaquin coastal oblique aerial survey flight path on October 7, 2015, divided into 5-minute (time) segments. The flight path is represented by the alternating purple and yellow lines. Pages containing thumbnail images of the photographs, referred to as contact sheets, were created based on these segments. Click on the 5-minute segment name to view each contact sheet. |
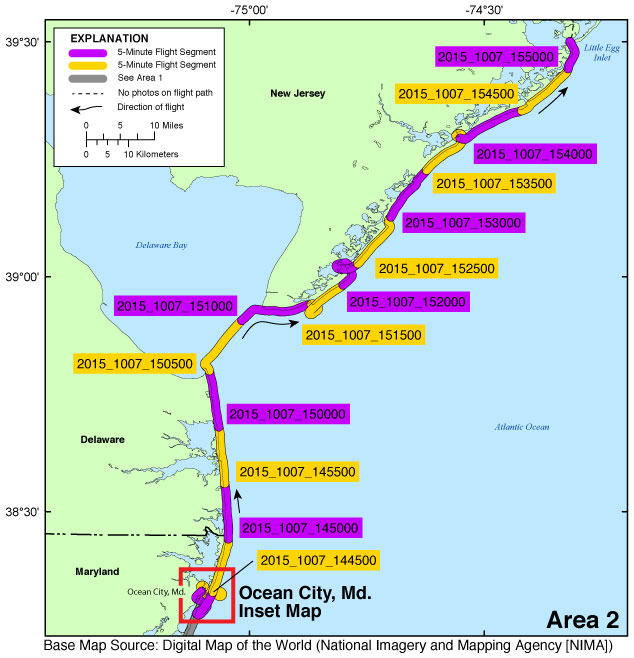
Figure 3B. Area 2—Ocean City, Maryland, to Little Egg Inlet, New Jersey. Map showing the post-Hurricane Joaquin coastal oblique aerial survey flight path on October 7, 2015, divided into 5-minute (time) segments. The flight path is represented by the alternating purple and yellow lines. Pages containing thumbnail images of the photographs, referred to as contact sheets, were created based on these segments. Click on the 5-minute segment name to view each contact sheet. Click on the inset box to view a detailed map of the area. |
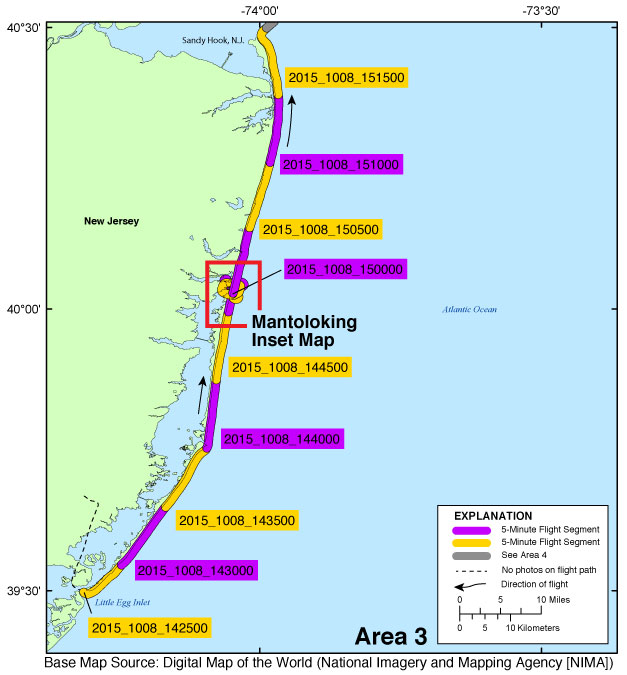
Figure 3C. Area 3—Little Egg Inlet, New Jersey, to Sandy Hook, New Jersey. Map showing the post-Hurricane Joaquin coastal oblique aerial survey flight path on October 8, 2015, divided into 5-minute (time) segments. The flight path is represented by the alternating purple and yellow lines. Pages containing thumbnail images of the photographs, referred to as contact sheets, were created based on these segments. Click on the 5-minute segment name to view each contact sheet. Click on the inset box to view a detailed map of the area. |
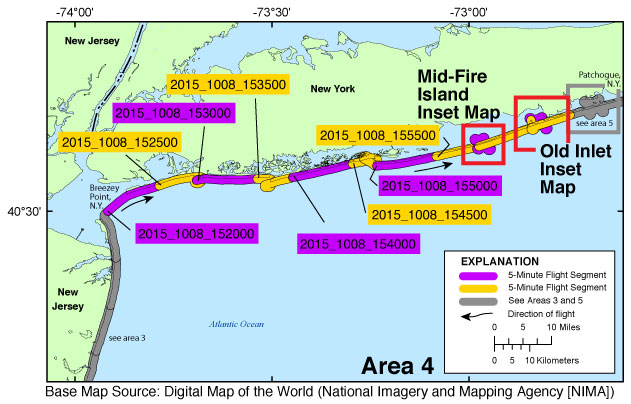
Figure 3D. Area 4—Breezy Point, New York, to Patchogue, New York. Map showing the post-Hurricane Joaquin coastal oblique aerial survey flight path on October 8, 2015, divided into 5-minute (time) segments. The flight path is represented by the alternating purple and yellow lines. Pages containing thumbnail images of the photographs, referred to as contact sheets, were created based on these segments. Click on the 5-minute segment name to view each contact sheet. Click on the inset box to view a detailed map of the area. |
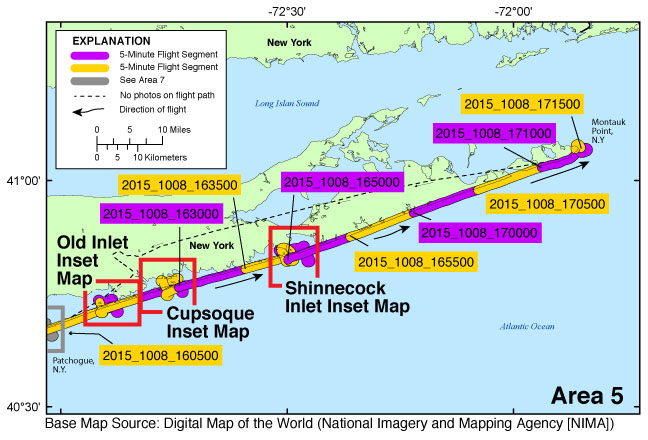
Figure 3E. Area 5—Patchogue, New York, to Montauk Point, New York. Map showing the post-Hurricane Joaquin coastal oblique aerial survey flight path on October 8, 2015, divided into 5-minute (time) segments. The flight path is represented by the alternating purple and yellow lines. Pages containing thumbnail images of the photographs, referred to as contact sheets, were created based on these segments. Click on the 5-minute segment name to view each contact sheet. Click on the inset box to view a detailed map of the area. |
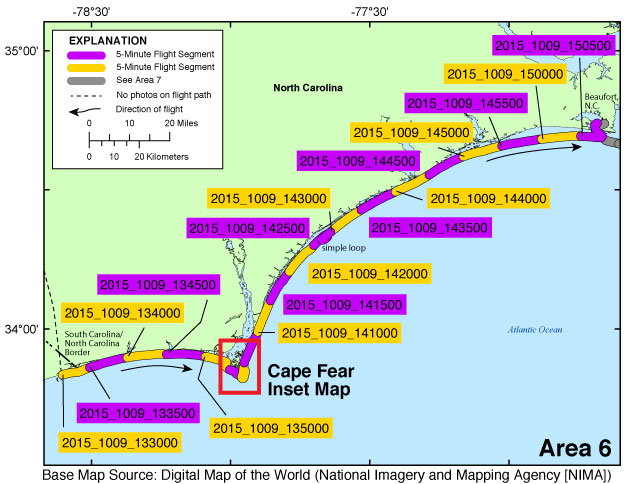
Figure 3F. Area 6—South Carolina/North Carolina border to Beaufort, North Carolina. Map showing the post-Hurricane Joaquin coastal oblique aerial survey flight path on October 9, 2015, divided into 5-minute (time) segments. The flight path is represented by the alternating purple and yellow lines. Pages containing thumbnail images of the photographs, referred to as contact sheets, were created based on these segments. Click on the 5-minute segment name to view each contact sheet. Click on the inset box to view a detailed map of the area. |
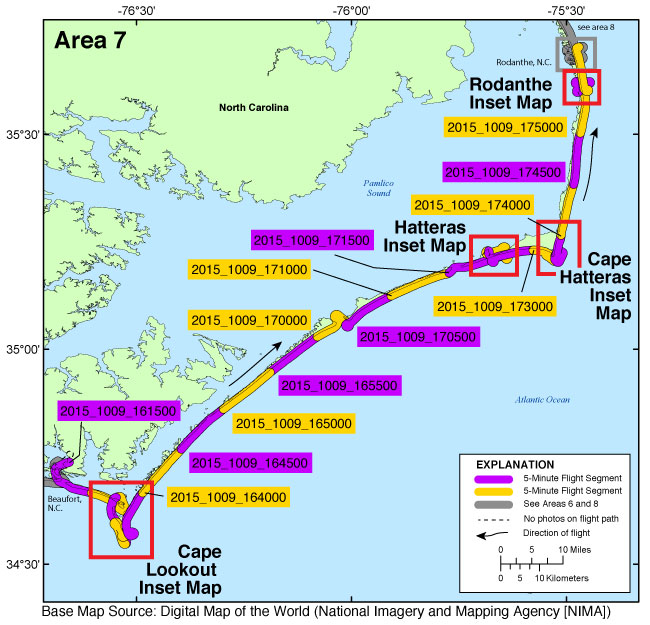
Figure 3G. Area 7—Beaufort, North Carolina, to Rodanthe, North Carolina. Map showing the post-Hurricane Joaquin coastal oblique aerial survey flight path on October 9, 2015, divided into 5-minute (time) segments. The flight path is represented by the alternating purple and yellow lines. Pages containing thumbnail images of the photographs, referred to as contact sheets, were created based on these segments. Click on the 5-minute segment name to view each contact sheet. Click on the inset box to view a detailed map of the area. |
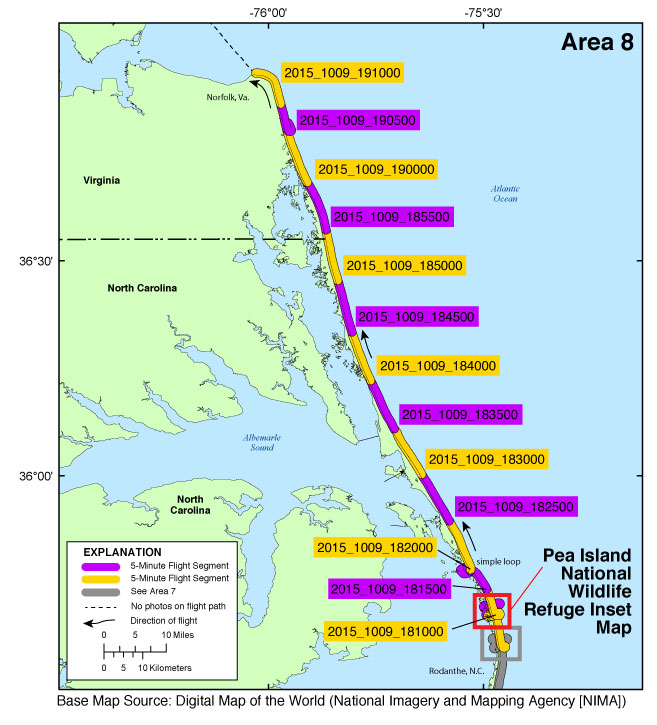
Figure 3H. Area 8—Rodanthe, North Carolina, to Norfolk, Virginia. Map showing the post-Hurricane Joaquin coastal oblique aerial survey flight path on October 9, 2015, divided into 5-minute (time) segments. The flight path is represented by the alternating purple and yellow lines. Pages containing thumbnail images of the photographs, referred to as contact sheets, were created based on these segments. Click on the 5-minute segment name to view each contact sheet. Click on the inset box to view a detailed map of the area. |
Ocean City, Maryland, Inset Map | Mantoloking Inset Map | Mid-Fire Island Inset Map | Old Inlet Inset Map | Cupsoque Inset Map
Shinnecock Inset Map | Cape Fear Inset Map | Cape Lookout Inset Map | Hatteras Inset Map | Cape Hatteras Inset Map
Rodanthe Inset Map | Pea Island Inset Map

![]() U.S. Department of the Interior |
U.S. Geological Survey
U.S. Department of the Interior |
U.S. Geological Survey
URL: http://pubsdata.usgs.gov/pubs/ds/0995/html/ds995_photos.html
Page Contact Information: GS Pubs Web Contact
Page Last Modified: Monday, 28-Nov-2016 20:48:11 EST
