


Data Acquisition
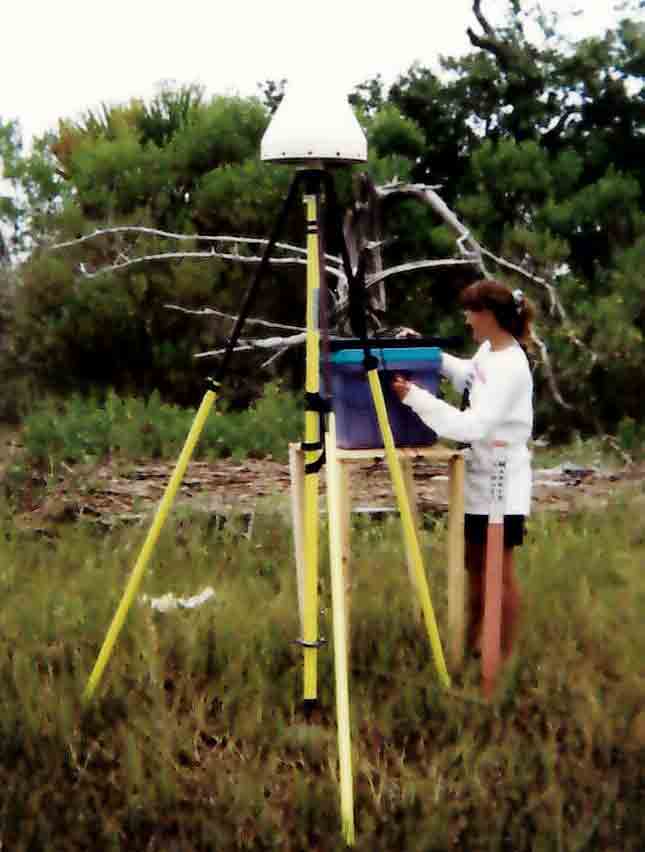
Figure 2. Photograph of a scientist setting up DGPS reference receiver in remote location (USGS). [Click to enlarge]
Bathymetric data were acquired using boat- and aircraft-based technologies which were developed by the U.S. Geological Survey (USGS), National Aeronautics and Space Administration (NASA), and commercial sources. Two boat-based hydrographic systems were employed for these projects. The majority of the projects used a single beam sonar system. When more detailed surveys were required, an interferometric swath sonar system was used. The aircraft method used a light detection and ranging (lidar) system flown on a twin engine airplane. All hydrographic survey systems used differential GPS (DGPS) that was post-processed to determine precise trajectories.
Differential GPS
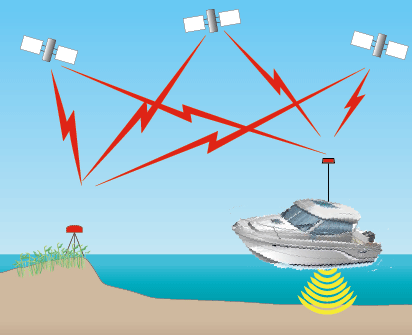
Differential GPS (DGPS) requires two receivers, one that is stationary, called the reference or base receiver, and another that is roving and collects trajectory measurements. The stationary receiver occupies a known location with exact XYZ coordinates (fig. 2). GPS receivers use timing information from at least four satellites to establish a position. Additional satellites can provide greater positional accuracy because of improved geometric solutions. Each GPS timing signal has some error or delay, depending on conditions of the ionosphere, troposphere, and local atmosphere. These errors degrade the position solution and vary with time.
Standard DGPS surveys operate with the reference and rover GPS receivers less the 100 kilometers (km) from each other. Since the GPS satellites are in such high orbits (about 20,200 km), the signals received by the reference and rover receivers experience almost identical timing delays because they are proportionally very close together compared to the satellite distance. Therefore, the errors for the reference and rover receivers will be almost identical.
Differential GPS eliminates most errors that are common to both the reference receiver and the roving receiver. Because the position of the reference receiver is exactly known, the exact timing can be computed. For each signal, the computed timing is compared to the measured timing, and the difference (termed an “error correction”) is applied to the rover receiver to correct its measured position. The closer the rover receiver is to the reference receiver, the more accurate the correction.
Under ideal survey conditions, that is, eight or more satellites available and favorable ionosphere, troposphere, and atmosphere conditions, DGPS on short base lines have errors of approximately 4 centimeters (cm) horizontally and 8 cm vertically. Due to the relative geometry of the GPS receivers and the satellites, it can be assumed that the computed horizontal position is twice as accurate as the corresponding vertical position.
Single-Beam Acquisition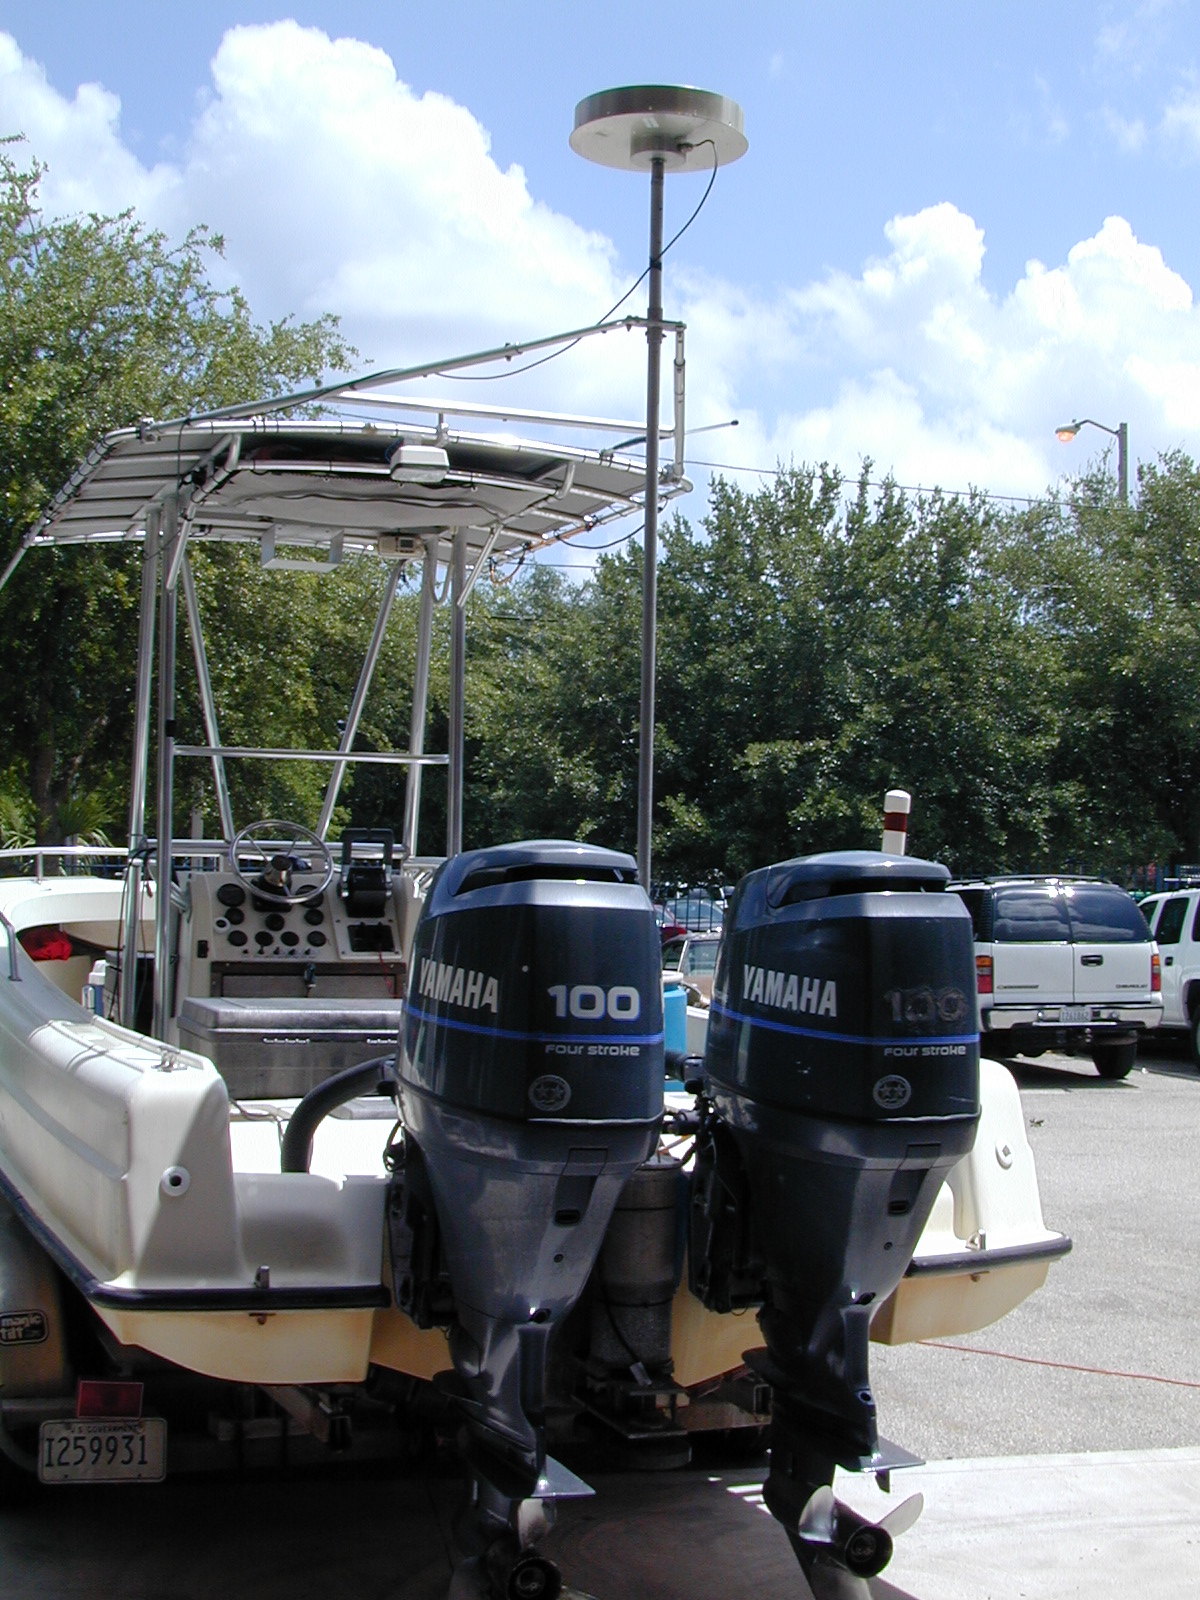
Figure 3. Photograph of SANDS transducers and heave-roll-pitch canister at stern of the survey boat, R/V Streeterville (USGS). [Click to enlarge]
Single-beam sonar data were collected using the single-beam acoustic system, System for Accurate Nearshore Depth Surveying (SANDS). SANDS was developed in 1992 to assess the effects of Hurricane Andrew. The system uses L1/L2, full carrier phase GPS receivers with Dorne-Margolintype choke ring antennas, a motion compensator (heave, pitch, and roll), and a survey grade fathometer (fig. 3). Designed for shallow-water operation, the fathometer is configured such that one transducer generates a sound pulse while the other (passive) transducer receives the bottom returned signal. To correct for varying water densities, speed of sound measurements were continuously measured. Data from all onboard sensors were recorded with Hypack software.
The primary boats used were either a 22-foot (ft) Boston Whaler (R/V Streeterville) or a 26-ft Glacier Bay(R/V Cat Boat) outboard motor boat. A jet ski and canoe were used for the Lemon Bay project because of the very shallow water depths.
Interferometric Swath Acquisition
Interferometric swath systems measure depths across a wide track, providing high resolution and accurate data. Swath sonar data were acquired with the SUBMETRIX system that measures the depth and sonar reflectivity of the seabed in a line extending outward from the transducers (fig. 4). Each line of depth measurements is called a "profile." As the survey vessel moves forward, the profiles combine to form a ribbon of depths across the survey area. Such a ribbon is called a "swath." The SUBMETRIX system uses an "interferometry" sonar technique. The term "interferometry" is used to describe swath-sounding sonar techniques that use the phase content of the sonar signal to measure the angle of a wave front returned from a sonar target. The system uses L1/L2, full carrier phase GPS receivers with Dorne-Margolin type choke ring antennas, and a motion compensator (heave, pitch, and roll). To correct for varying water densities, speed of sound measurements were continuously measured at the sonar head. Data from all onboard sensors were recorded with BathySwath software.
Lidar Acquisition
Aircraft based hydrographic data were acquired using NASA's Experimental Advanced Airborne Research Lidar (EAARL) (Wright and Brock, 2002) lidar system. The EAARL airborne lidar system included a raster-scanning, water penetrating, full-waveform, adaptive lidar and an array of precision kinematic GPS receivers, which provided for submeter georeferencing of each laser and hyper-spectral sample (fig. 5). The EAARL system operated from a Cessna© 310 twin engine aircraft that traveld at a nominal 97 knots (50 meters per second [m/s]) at an elevation of 300 meters (m) and energized the laser at a rate of 2,000 pulses per second. The system used a green light (532-nanometer [nm]) laser with a very low-power, eye-safe, laser pulse. Return waveforms were partially analyzed in real-time to locate the key features such as the digitized transmit pulse, the first return, and the last return. The EAARL system penetrated the water column to approximately 1.5 secchi disk depth. Data were recorded with in-house developed software.
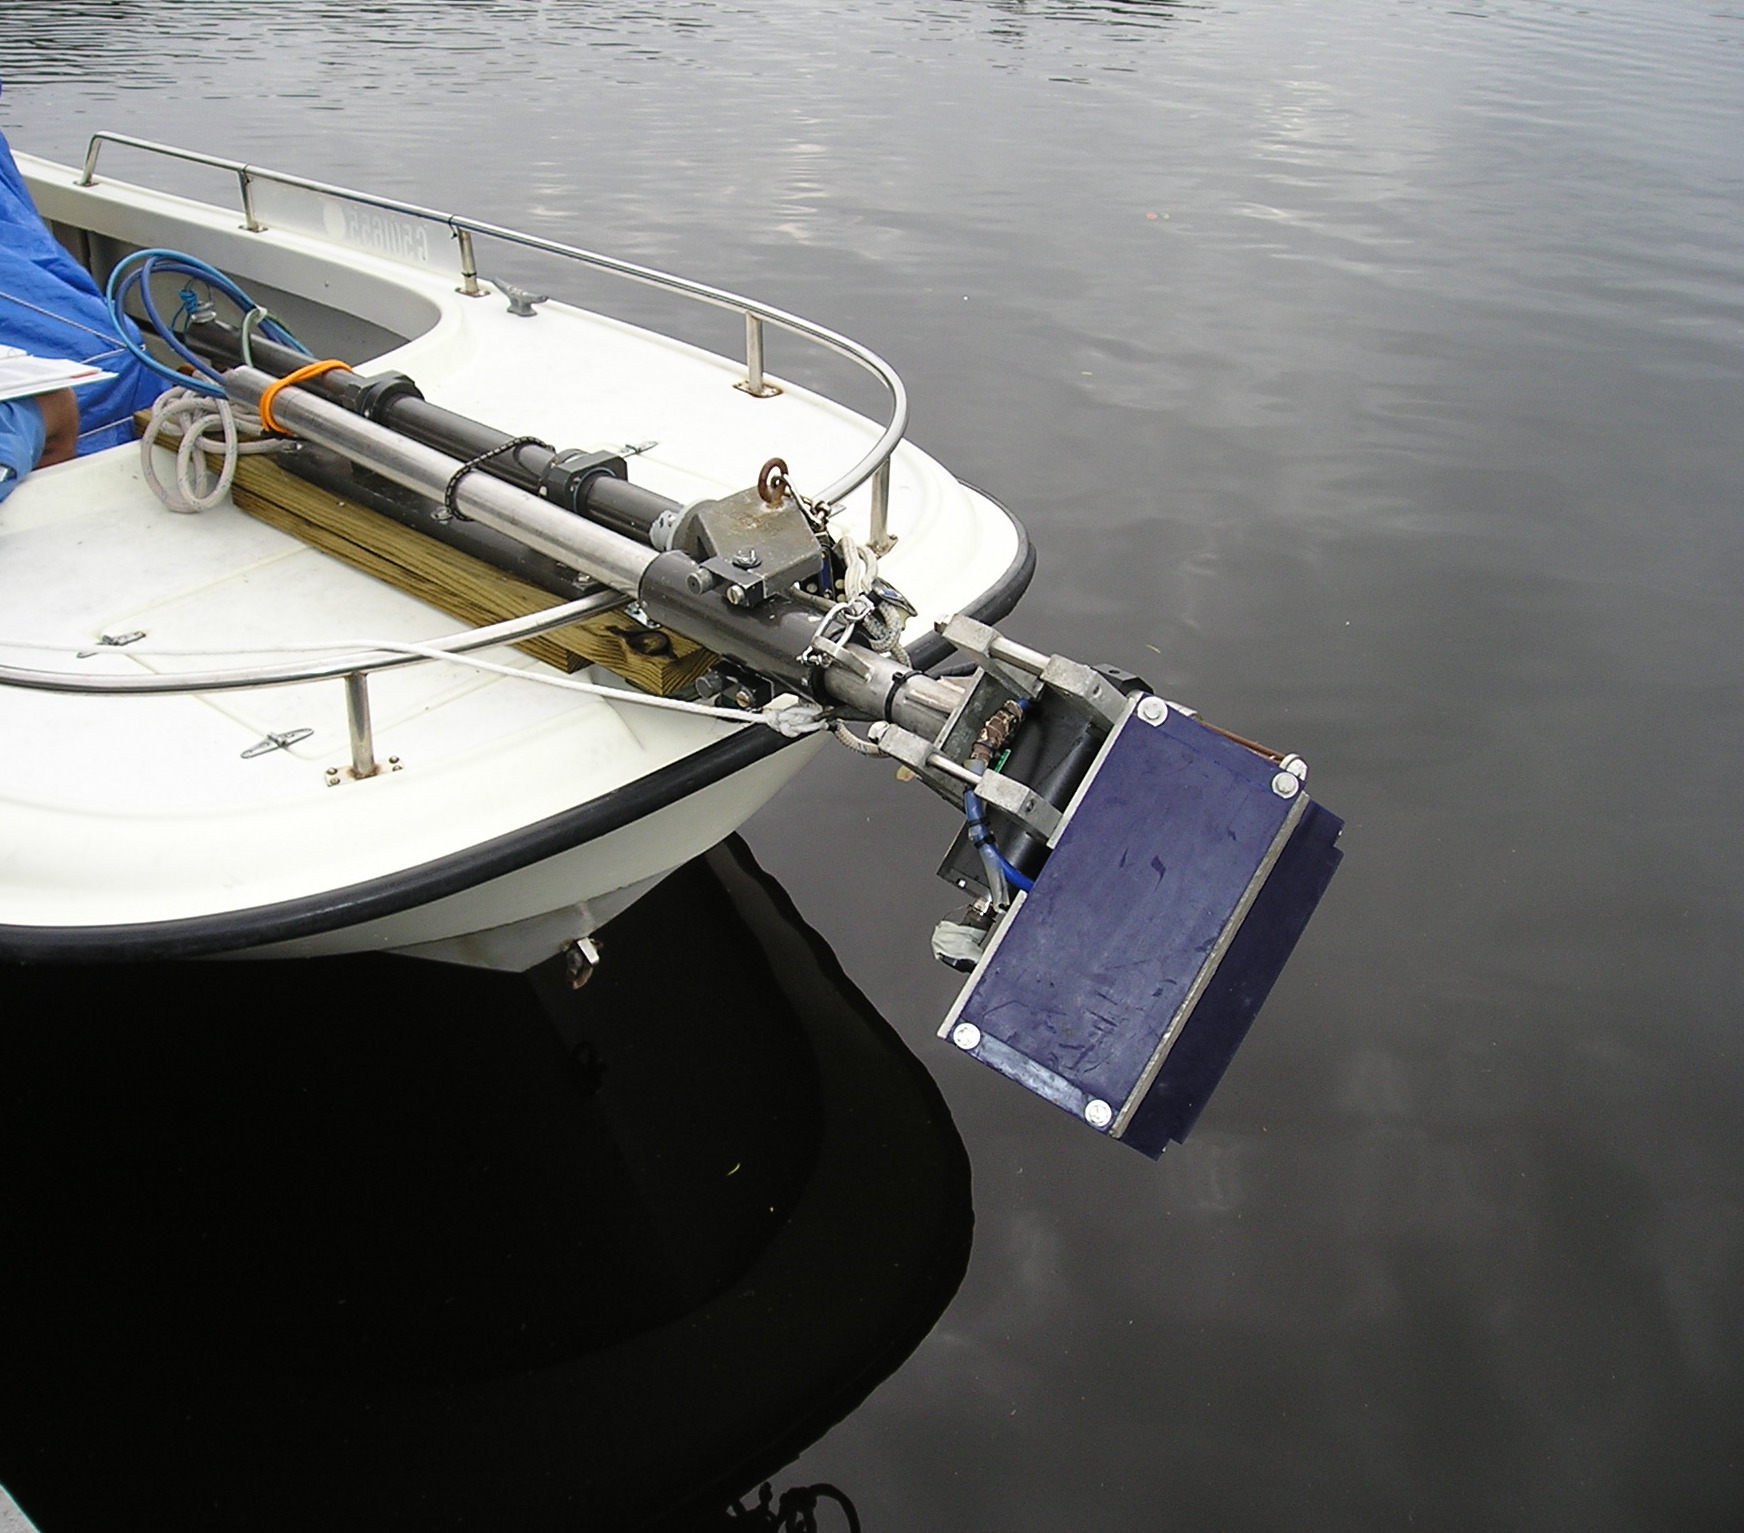 Figure 4. Photograph of the swath system transducers mounted on the USGS survey boat, R/V Streeterville (USGS). [Click to enlarge] |
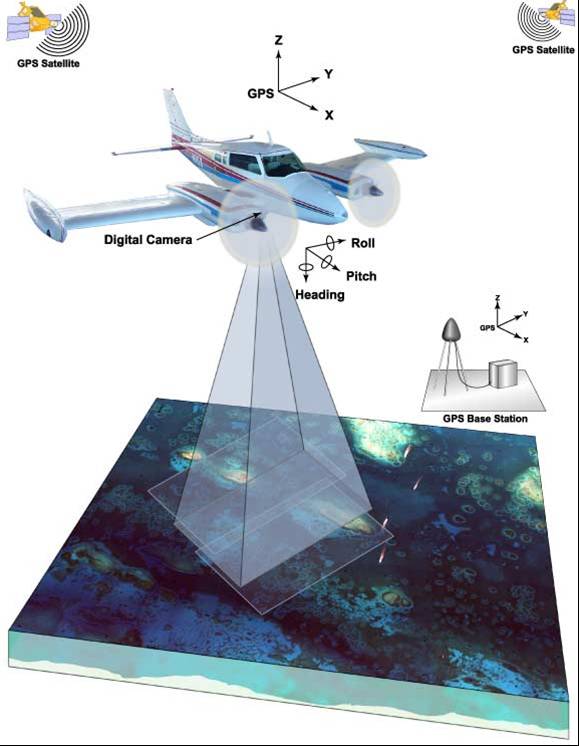 Figure 5. Schematic of EAARL components (NASA). [Click to enlarge] |

![]() U.S. Department of the Interior |
U.S. Geological Survey
U.S. Department of the Interior |
U.S. Geological Survey
URL: http://pubsdata.usgs.gov/pubs/ds/1031/ds1031_acquisition.html
Page Contact Information: GS Pubs Web Contact
Page Last Modified: Monday, 31-Jul-2017 15:58:07 EDT