Data Series 1100
| Laboratory Methods and AnalysesSite ElevationsBase station data were post-processed through the National Geodetic Survey (NGS) On-Line Positioning User Service (OPUS). The time-weighted position calculated from all base station occupations did not differ significantly from the NPS REST control coordinates; therefore, the control coordinates were used for post-processing. The base-station coordinates were imported into GrafNav, version 8.5 (NovAtel Waypoint Product Group), and the data from the rover GPS were post-processed to the concurrent base-station session data. During GPS data acquisition at core location P25-C07, a recording error occurred, and no concurrent base-station data were recorded at REST. Rover data from this location were instead post-processed to the concurrent data recorded at the NGS Continuously Operating Reference Station (CORS) ZNY1 on Long Island. The final core locations, including elevation, are the post-processed DGPS coordinates; baseline distances to all core locations were 21 km or less. These data are included in the site locations files accessible from Bernier and others (2018). Vibracore ProcessingEach vibracore was split lengthwise, photographed with a Canon Powershot SX20 IS digital camera, described macroscopically using standard sediment-logging methods, and subsampled for grain-size analysis. Grain-size samples consisted of 2-cm sections sampled at varying intervals down-core depending on the number and thickness of the observed sedimentologic units. The core logs and photographs can be downloaded from Bernier and others (2018). Textural descriptions for the core logs are based on macroscopic observations; the quantitative grain-size data are represented by down-core plots on the core logs (fig. 5).  Figure 5. Example grain-size plots and log from vibracore P22-C14. Sediment color is based on the Munsell® soil color system. Colored lines with dates indicate depths where the core intersected previously surveyed beach surfaces (beach elevation profiles) (value plotted is Dcomp (m), in 2016-322-FA_ProfElev_to_CoreDepth.pdf, also see figs. 6, 7, and 8). [cm, centimeter; mm, millimeter] [Click figure to enlarge] Grain-Size AnalysisGrain-size analyses were performed using a Coulter LS 13 320 particle-size analyzer, which uses laser diffraction to measure the size distribution of sediments ranging in size from 0.4 micron (μm) to 2 millimeters (mm) (clay to very coarse-grained sand). A total of 315 samples were analyzed from 14 vibracores. Prior to analysis, each sample was dried at 40 degrees Celsius (°C) for 24 hours. Two subsamples (sets) from each sample were processed (four runs per set) through the LS 13 320 particle-size analyzer, which measures the particle-size distribution of each sample by passing sediment suspended in solution between two narrow panes of glass in front of a laser. Light is scattered by the particles into characteristic refraction patterns measured by an array of photodetectors as intensity per unit area and recorded as relative volume for 92 size-related channels (bins). To prevent shell fragments and coarse material from damaging the LS 13 320, particles greater than 2 mm in diameter were separated from each subsample prior to analysis using a number 10 (2,000 μm [2 mm]) U.S. standard sieve, which meets the American Society for Testing and Materials (ASTM) E11 standard specifications for determining particle size using woven-wire test sieves. The fraction of sediment greater than 2 mm was recorded as a percentage of the subsample dry weight. The raw grain-size data were run through GRADISTAT, version 8 (Blott and Pye, 2001), which calculates the geometric (in metric units) and logarithmic (in phi units, φ; Krumbein, 1934) mean, sorting, skewness, and kurtosis of each sample, using the Folk and Ward (1957) method as well as the cumulative particle-size distribution. GRADISTAT also calculates the fraction of sediment from each sample by size category (for example, clay, coarse silt, fine sand) based on a modified Wentworth (1922) size scale. A macro developed by the USGS was applied to calculate the average and standard deviation of each sample (four runs per set, eight runs per sample) and highlight runs that varied from the set or sample average by more than plus or minus (±) 1.5 standard deviations. Excessive deviations from the mean are likely the result of equipment error or extraneous material in the sample and, therefore, are not considered representative of the sample. Those runs were removed from the results, and the sample average was recalculated using the remaining runs. The grain-size data are included as down-core plots with the core logs (fig. 5); the individual run statistics as well as the averaged sample statistics (summary statistics) and graphical representations of the data are also available from Bernier and others (2018). Integration of Vibracores With Beach Elevation ProfilesVibracores were collected repeatedly along previously occupied beach-profile elevation transects (profiles 10, 11, 22, 25, 26, and 29; fig. 3; beach elevation profile data, see U.S. Geological Survey, undated). The depth at which each core penetrated older beach surfaces (fig. 6), if preserved, is labeled on the core logs (fig. 5 and Core Viewer). Not all previously surveyed beach surfaces are preserved in the cores because beach width and elevation vary seasonally and in response to storms (Hapke and others, 2013; Brenner and others, 2018). Erosion of beach sediments can be identified by comparing the beach elevation profiles at a given location: if the elevation of a younger (more recent) survey is less than that of an older survey, the beach surface represented by the older survey will not be preserved in the sedimentary record. Conversely, if beach elevations increase between survey dates, the sediments that accumulated between those surveys will be preserved, and chronostratigraphic depositional packages can be identified. Because compaction of sediment commonly occurs during vibracoring (Morton and White, 1997), the extracted core length is often less than the total depth the core penetrated below the sediment surface. Percentage core compaction is determined by dividing the recovered core length (L) by total penetration (P). To compare the published profile elevations with sediment depths, the profile elevations first had to be transposed into the “compacted” depth framework at each core location (fig. 7), using the following steps:
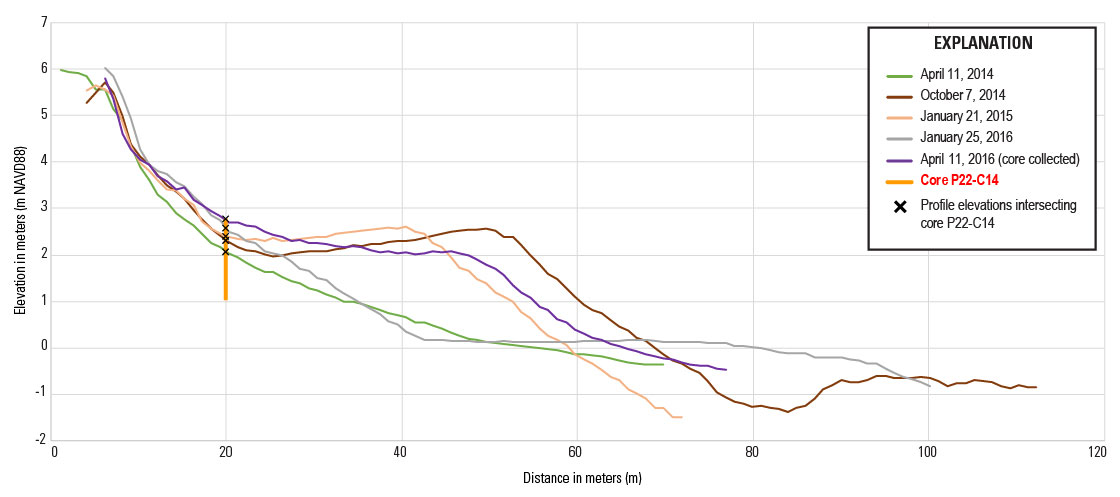 Figure 6. Example of plot showing vibracore intersecting previously surveyed beach elevation profiles. [m, meter; NAVD88, North American Vertical Datum of 1988] [Click figure to enlarge] 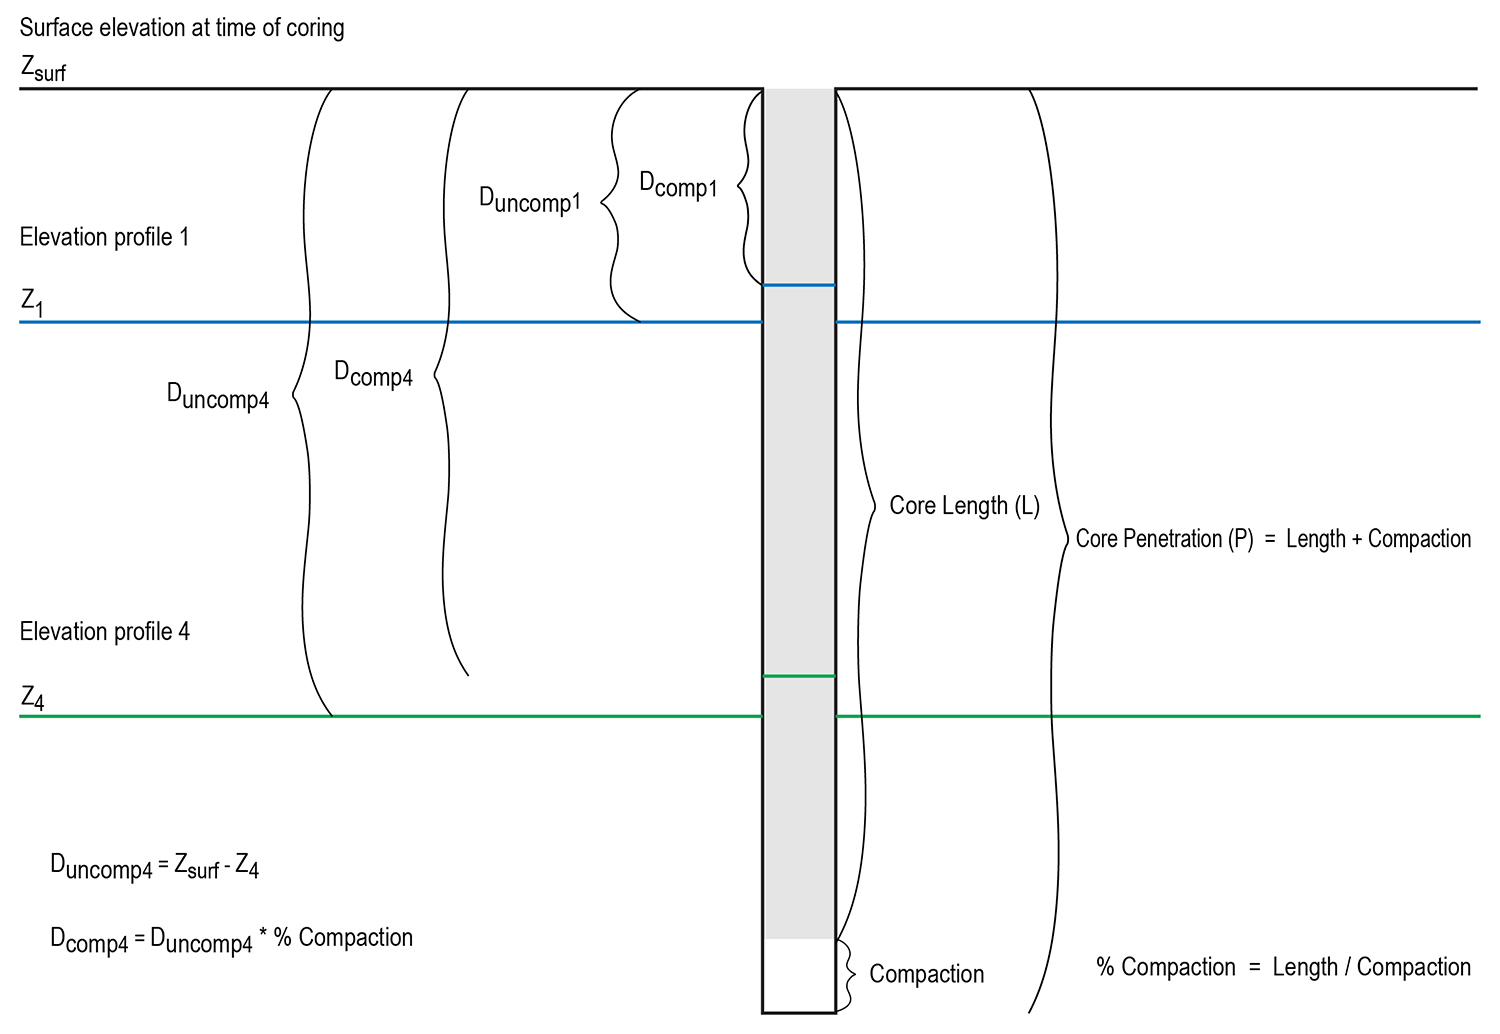 Figure 7. Illustration showing relations of core length, penetration, and compaction with calculations to translate beach elevation profiles to compacted depths of cores. [surf, surface; Dcomp, depth compacted; Duncomp, depth uncompacted; Z, elevation; L, core length; P, core penetration; %, percentage] [Click figure to enlarge] |

![]() U.S. Department of the Interior |
U.S. Geological Survey
U.S. Department of the Interior |
U.S. Geological Survey
URL: http://pubsdata.usgs.gov/pubs/ds/1100/ds1100_data-analysis.html
Page Contact Information: GS Pubs Web Contact
Page Last Modified: Tuesday, 02-Jul-2019 00:12:40 EDT
