Data Series 437
· Abstract · Introduction—Video of Exploration and Production Through Time · Undiscovered Oil and Gas Resources in the Southwestern Wyoming Province · Undiscovered Gas in the Mesaverde Total Petroleum System · The Almond Continuous Gas Assessment Unit · The Rock Springs–Ericson Gas Assessment Unit · Undiscovered Gas in the Mesaverde–Lance–Fort Union Composite Total Petroleum System · The Mesaverde–Lance–Fort Union Continuous Gas Assessment Unit · Undiscovered Gas in the Lewis Total Petroleum System · The Lewis Continuous Gas Assessment Unit · Undiscovered Gas in the Hilliard-Baxter-Mancos Total Petroleum System · The Hilliard-Baxter-Mancos Continuous Gas Assessment Unit · Undiscovered Gas in the Mowry Composite Total Petroleum System · The Mowry Continuous Gas Assessment Unit · Undiscovered Gas in the Lance–Fort Union Composite Total Petroleum System · The Lance–Fort Union Continuous Gas Assessment Unit · Reservoirs That Contain the Majority of Undiscovered Gas Resources |
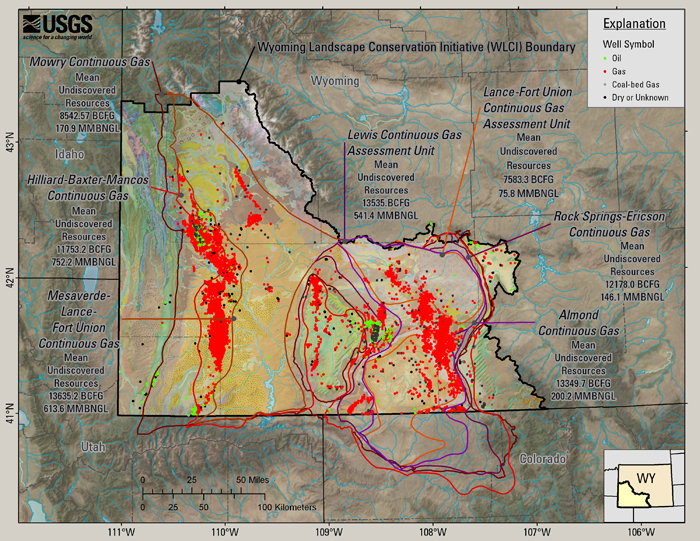
Reservoirs That Contain the Majority of Undiscovered Gas ResourcesBecause the well information shown above with each AU is formation specific and not AU specific, individual wells are shown with more than one AU. For example, the Lance–Fort Union Continuous AU produced from some of the same formations as the Mesaverde–Lance–Fort Union Continuous AU, but covers a different geographic area. By looking at all seven AUs in which the majority of undiscovered gas resources are distributed, and the wells that produce from or terminate in geologic units of these AUs, we can see the well data that was available at the time of the 2002 USGS assessment of undiscovered gas resources (fig. 24).
Figure 24. Map showing all seven AUs that contain the majority of undiscovered gas resources with wells that produced from or terminated in units of these AUs at the time of the 2002 assessment. Because of the depth component, viewing multiple AUs in static maps makes it difficult to distinguish between individual stratigraphic intervals that make up each AU. This type of data can be better analyzed using GIS technology in interactive maps, such as the published map files and the internet map services that are described in Live GIS Data and Maps. We can, however, look at the same information with additional wells that have been drilled since the assessment. These additional wells cover the time frame of 2002 to the spring of 2008 (fig. 25).
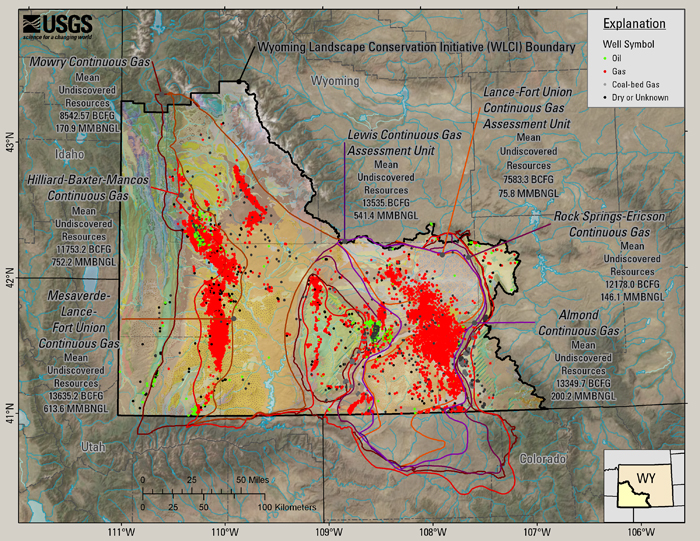
Figure 25. Map showing all seven AUs that contain the majority of undiscovered gas resources with wells that produce from or terminate in units of these AUs. To get a better idea of the drilling activity since the 2002 assessment, figure 26 shows only those wells that have been drilled from 2002 through the spring of 2008 in the seven AUs that contain the majority of undiscovered gas resources.
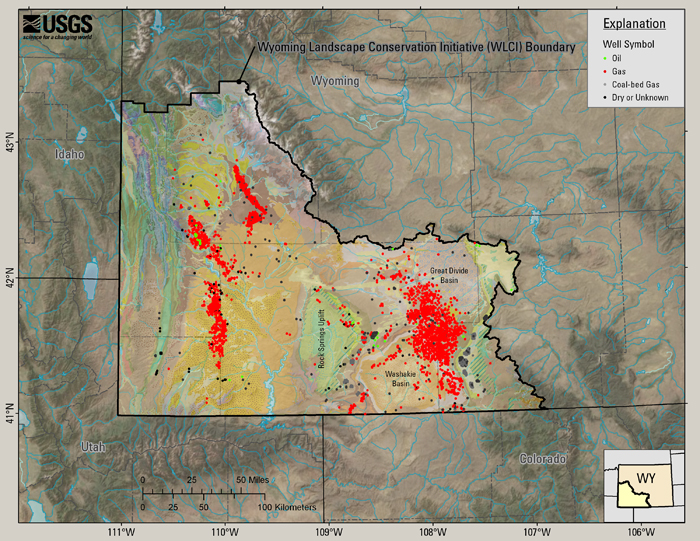
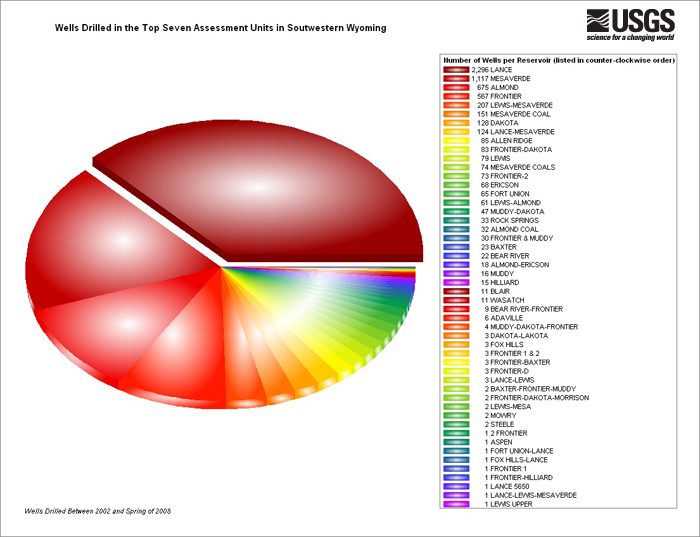
Figure 26. Map showing only those wells that have been drilled from 2002 through the Spring of 2008 in the seven AUs that contain the majority of undiscovered gas resources. Figure 26 shows that since the 2002 USGS assessment until the spring of 2008, there have been 6,171 wells completed in the seven AUs that contain the majority of the undiscovered gas resources. Of these wells, 461 have produced from or terminated in coal beds. The reservoir names and the number of wells from each reservoir, according to the WOGCC, are as follows:
Figure 27. ArcMap (ESRI, 2000b) pie chart showing the number of wells drilled to each reservoir in the top seven assessment units since 2002. Figure 28 shows those wells that have been completed from 2002 through the spring of 2008 in reservoirs that do not contain the majority of gas resources.
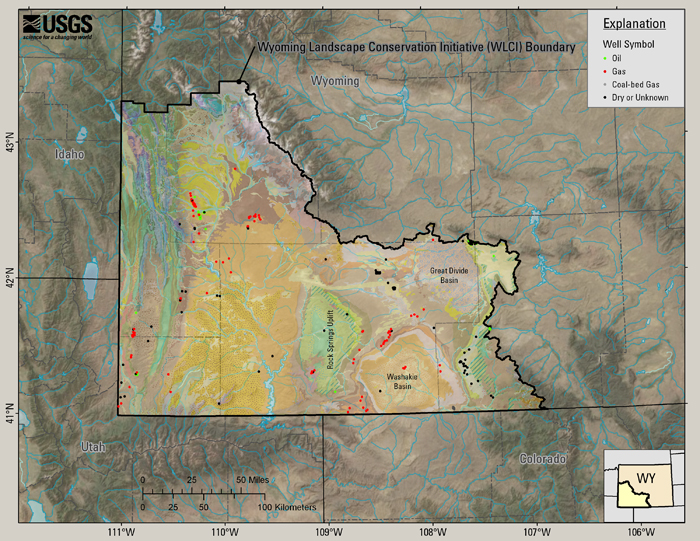
Figure 28. Map showing only those wells that have been drilled from 2002 through the Spring of 2008 in other than the seven AUs that contain the majority of undiscovered gas resources. Since 2002, 372 wells have been drilled in reservoirs that did not contain the majority of undiscovered gas resources in the Southwestern Wyoming Province. Of these 372 wells, 37 have no reservoir name association in the WOGCC database.
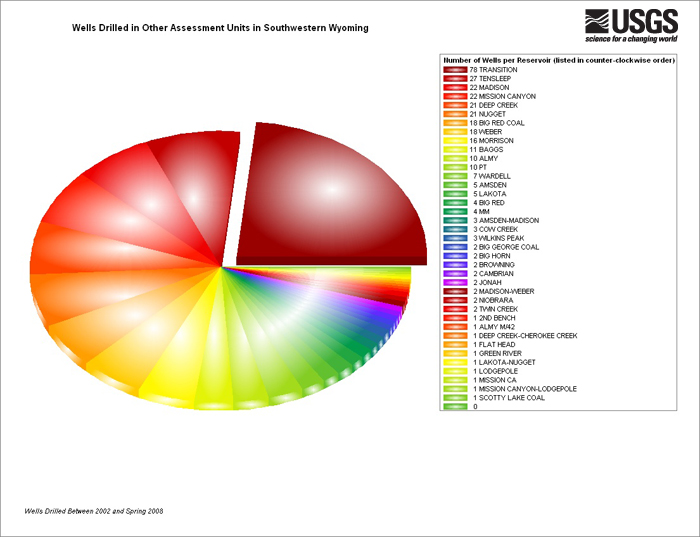
Figure 29. ArcMap (ESRI, 2000b) pie chart showing the number of wells drilled to each reservoir in other than the top seven assessment units since 2002. |

![]() U.S. Department of the Interior |
U.S. Geological Survey
U.S. Department of the Interior |
U.S. Geological Survey
URL: http://pubsdata.usgs.gov/pubs/ds/437/html/majgas.html
Page Contact Information: GS Pubs Web Contact
Page Last Modified: Monday, 28-Nov-2016 14:30:20 EST