U.S. Geological Survey Data Series 671
Home | Acronyms | Figures and Tables | Navigation | Equipment and Processing | Images | Logs | Metadata | Software
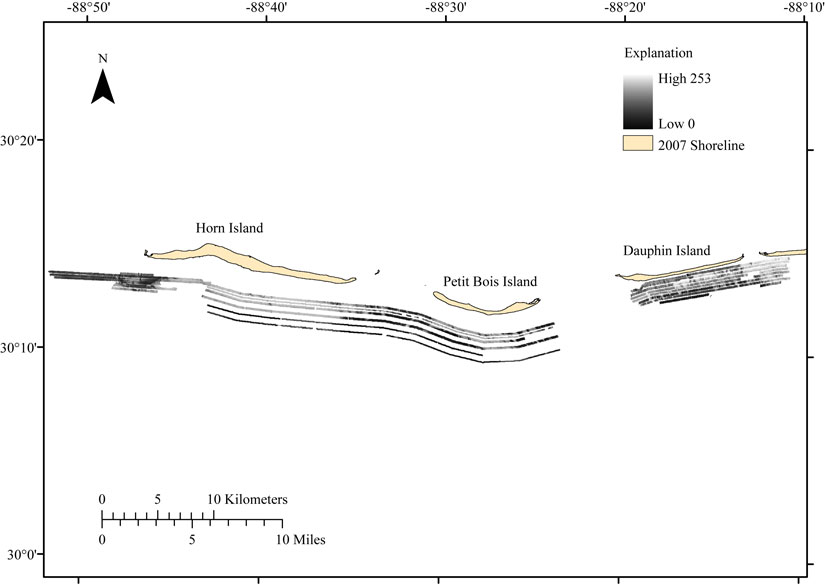
Figure 12. Map overview of the side scan sonar GeoTIFF image (1-meter pixels). Grid amplitude intensity values range from 0 to 253. Shoreline file is from 2007 processed EAARL LiDAR. |
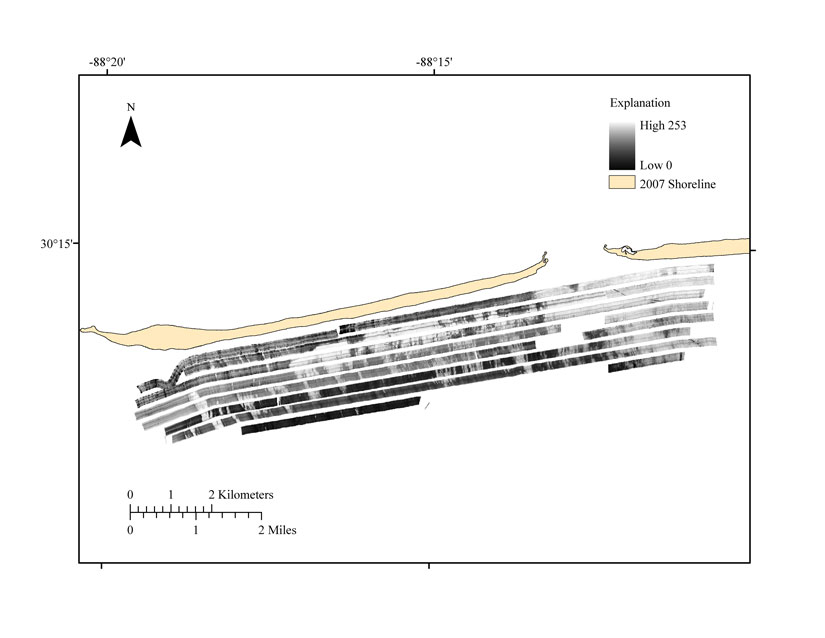
Figure 13. Map of the East Section from the side scan sonar GeoTIFF image (1-meter pixels). Grid amplitude intensity values range from 0 to 253. Shoreline file is from 2007 processed EAARL LiDAR. |
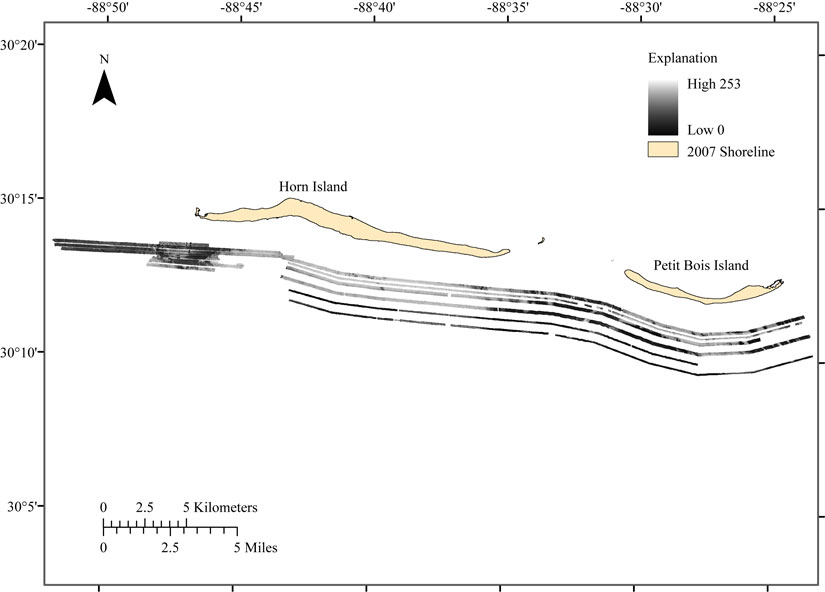
Figure 14. Map of the West Section from the side scan sonar GeoTIFF image (1-meter pixels). Grid amplitude intensity values range from 0 to 253. Shoreline file is from 2007 processed EAARL LiDAR.
|
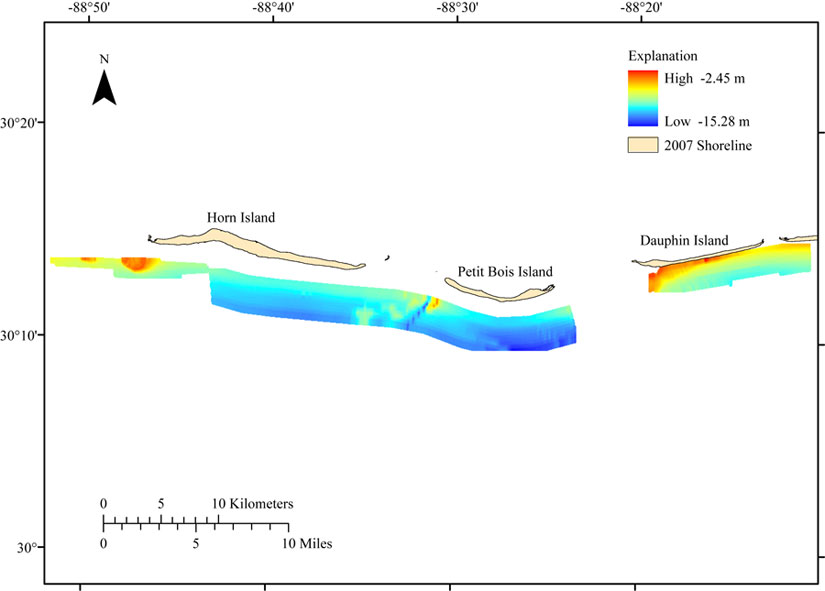
Figure 15. Map overview of the multibeam bathymetry 50-meter
grid GeoTIFF image. Grid values range from -2.45 to -15.28 meters. Data is referenced to WGS84 UTM Zone 16 for the horizontal datum and to MLLW for the vertical datum. Shoreline file is from 2007 processed EAARL LiDAR. |
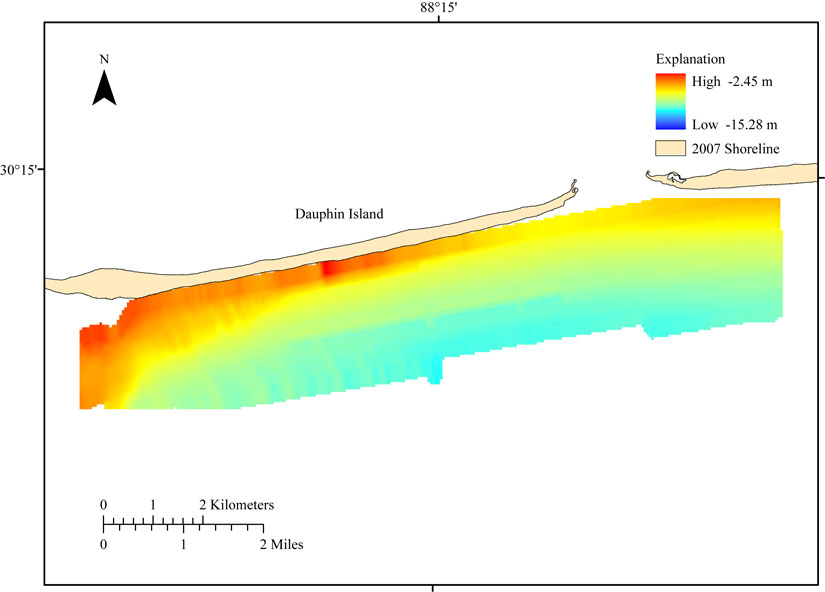
Figure 16. GeoTIFF image of the multibeam bathymetry 50-meter grid of the East Section in map view. Grid values range from -2.45 to -15.28 meters. Data is referenced to WGS84 UTM Zone 16 for the horizontal datum and to MLLW for the vertical datum. Shoreline file is from 2007 processed EAARL LiDAR. |
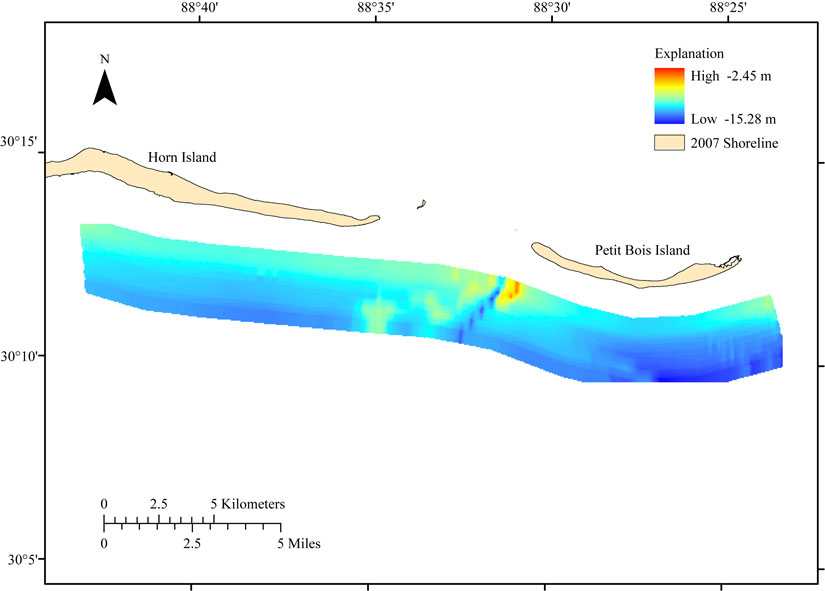
Figure 17. GeoTIFF image of the multibeam bathymetry 50-meter grid of West Section 1 in map view. Grid values range from -2.45 to -15.28 meters. Data is referenced to WGS84 UTM Zone 16 for the horizontal datum and to MLLW for the vertical datum. Shoreline file is from 2007 processed EAARL LiDAR. |
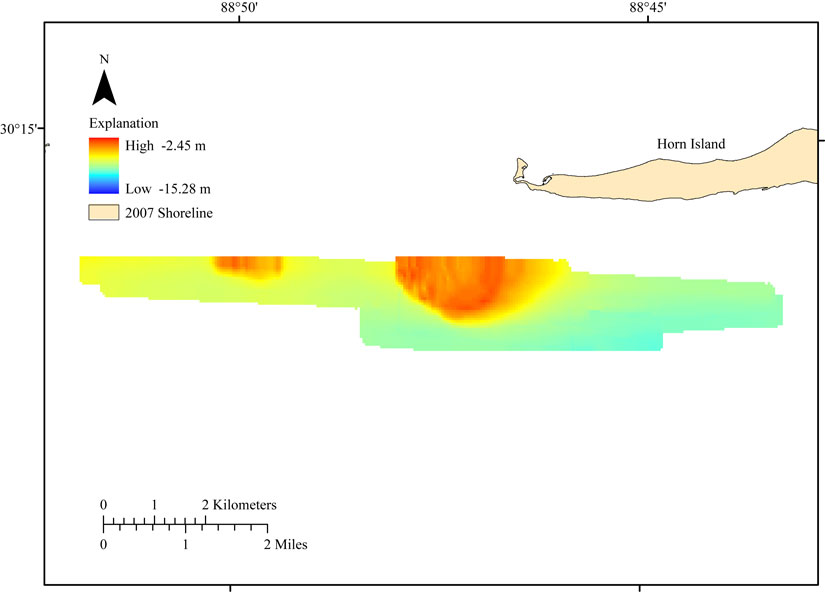
Figure 18. GeoTIFF image of the multibeam bathymetry 50-meter grid of West Section 2 in map view. Grid values range from -2.45 to -15.28 meters. Data is referenced to WGS84 UTM Zone 16 for the horizontal datum and to MLLW for the vertical datum. Shoreline file is from 2007 processed EAARL LiDAR. |
Home | Acronyms | Figures and Tables | Navigation | Equipment and Processing | Images | Logs | Metadata | Software

![]() U.S. Department of the Interior |
U.S. Geological Survey
U.S. Department of the Interior |
U.S. Geological Survey
URL: http://pubsdata.usgs.gov/pubs/ds/671/html/images.html
Page Contact Information: GS Pubs Web Contact
Page Last Modified: Monday, 28-Nov-2016 18:39:22 EST