U.S. Geological Survey Data Series 722
Figures |
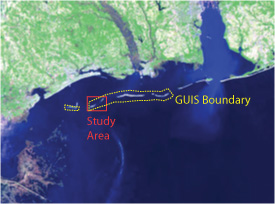
Figure 1. USGS cruise 07CCT01 study area, nearshore of West Ship Island and East Ship Island within Camille Cut, Gulf Islands National Seashore, Mississippi. |
Figure 2. Photograph of Fort Massachusetts, located on the northern shoreline of West Ship Island. |
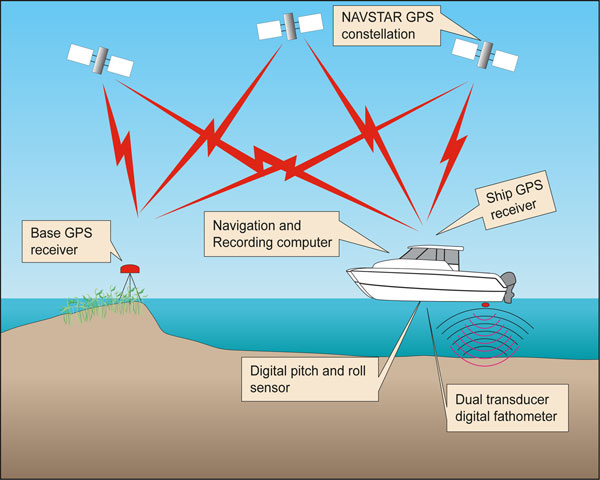
Figure 3. Diagram of SANDS data acquisition showing land-based GPS station (base) and ship-board receivers (rover). [larger version] |
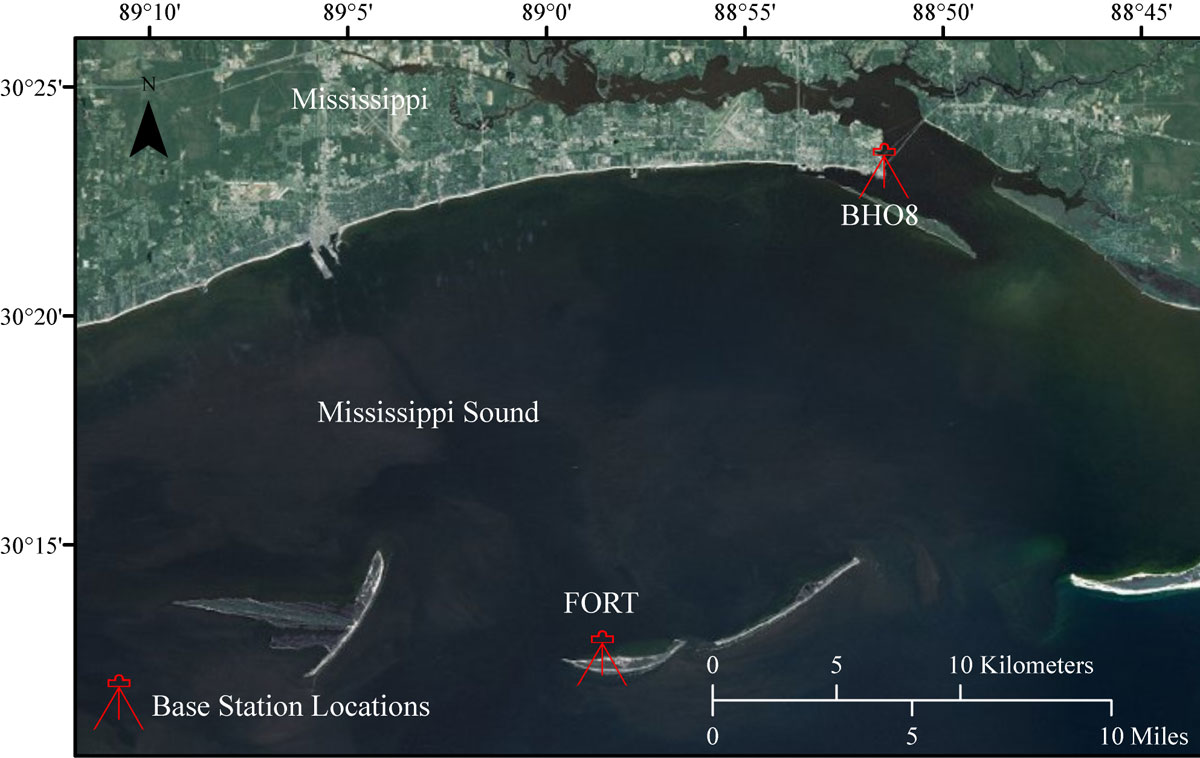
Figure 4. Map showing GPS base station locations for the 2007 survey. The site names and their affiliations are as follows: BH08 (NGS PID# = BH0866) and FORT (NGS PID# = BH1894 ). [larger version] |
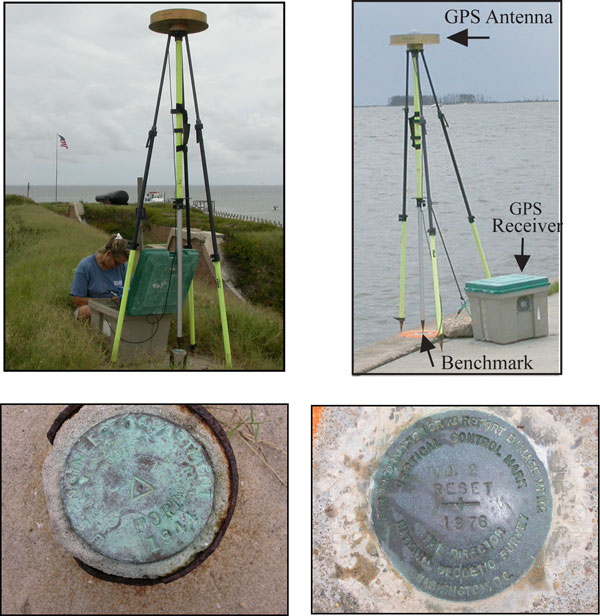
Figure 5. Photographs of the GPS base stations and their components. From left to right, FORT, atop Fort Massachusetts on West Ship Island; and BH08, located on the seawall at Point Cadet Marina in Biloxi, Mississippi. [larger version] |
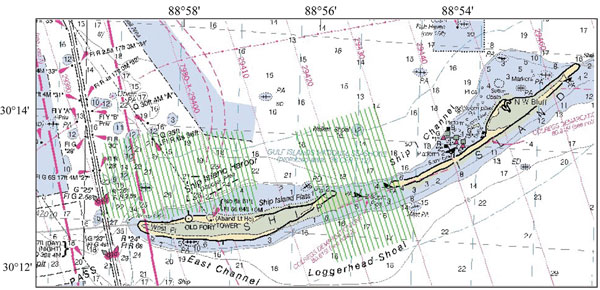
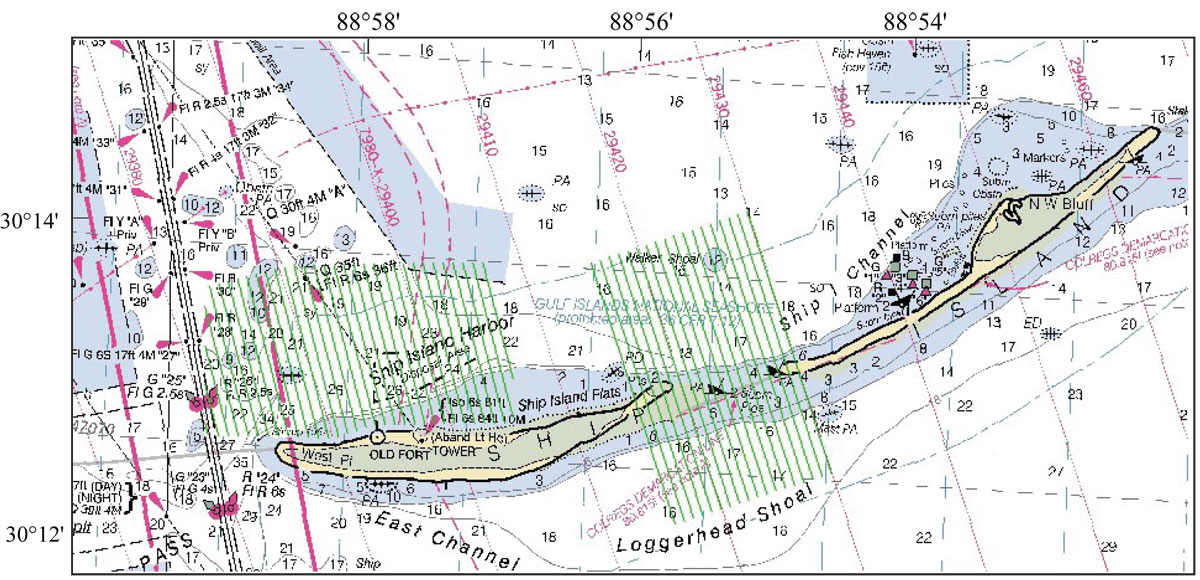
Figure 6. The planned tracklines (green lines) for USGS cruise 07CCT01, showing the area north of Fort Massachusetts and Camille Cut, overlain upon the digital NOAA Nautical Chart 11373. [larger version] |
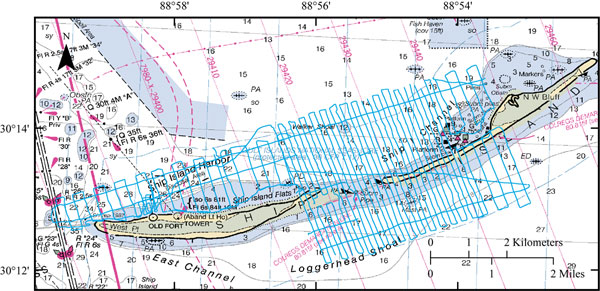
Figure 7. The surveyed tracklines (blue lines) for USGS cruise 07CCT01, which show that Camille Cut at the time of the survey was considerably larger than what was indicated on NOAA Nautical Chart 11373. [larger version] |
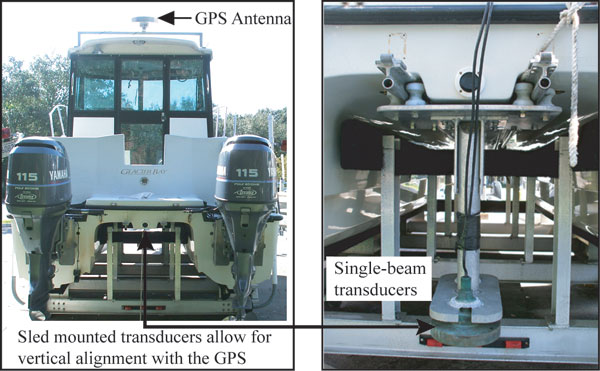
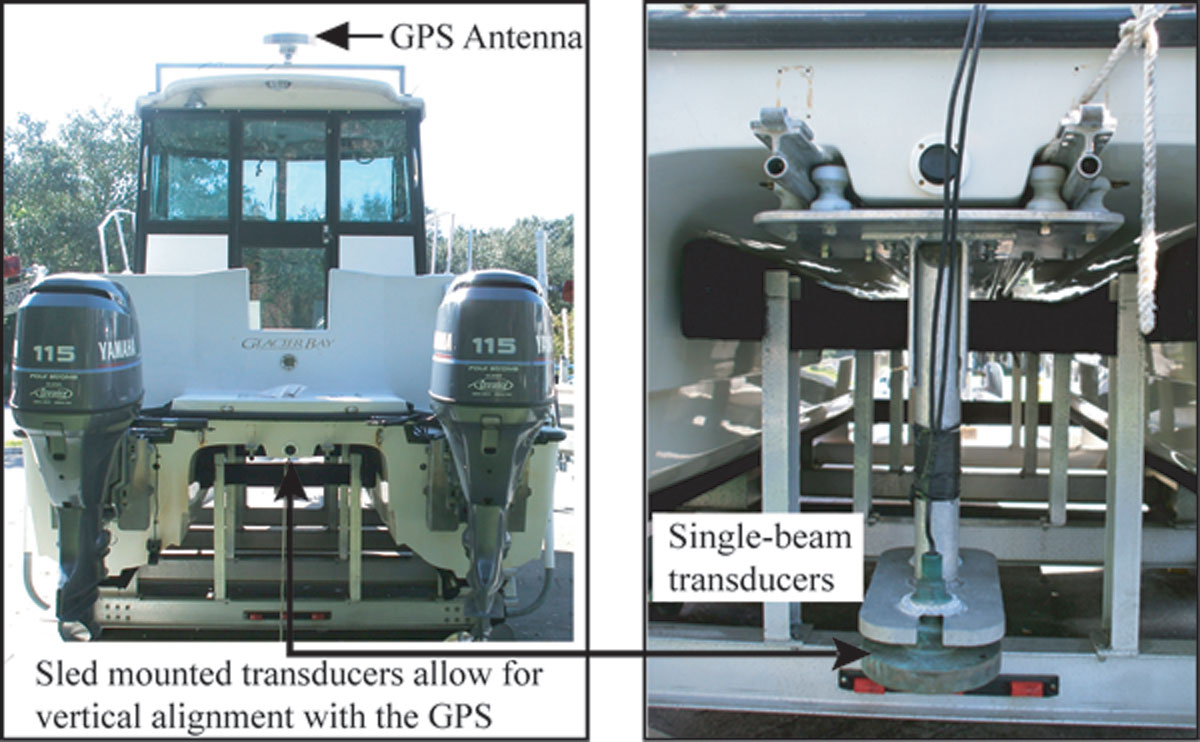
Figure 8. Photographs of the hardware components on the RV Survey Cat. [larger version] |
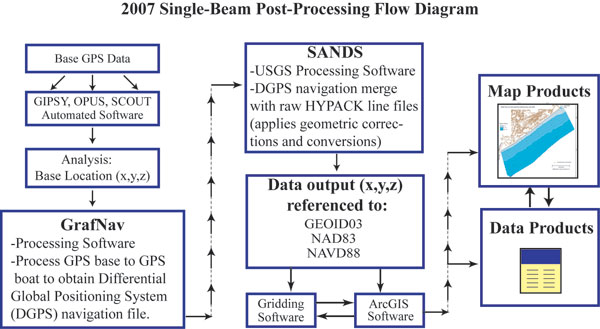
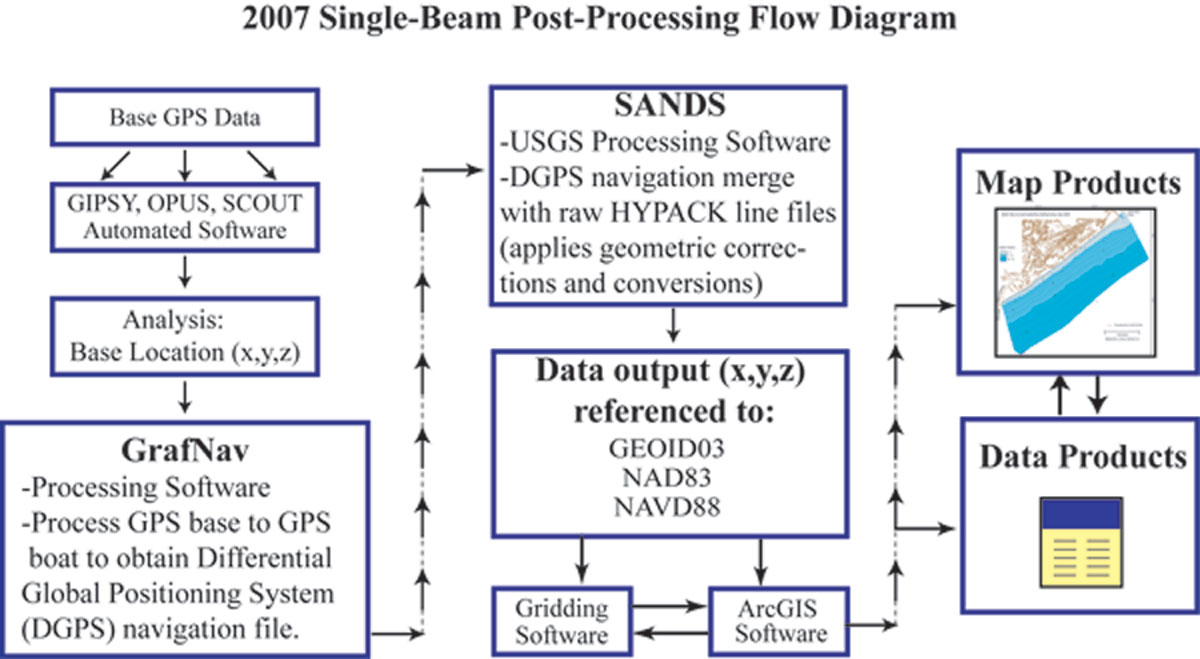
Figure 9. Diagram of the single-beam post-processing workflow indicating the progression and software components used to derive the bathymetric data and other products. [larger version] |
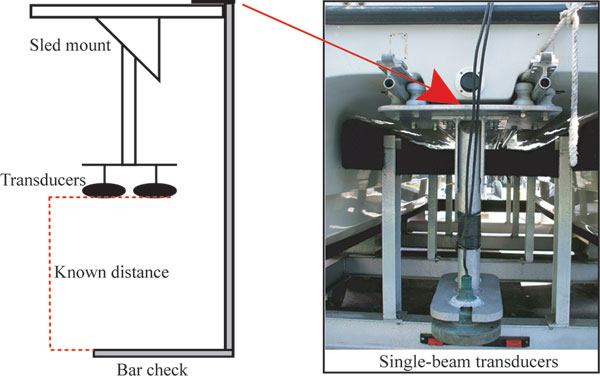
Figure 10. Diagram of a bar check. The red arrow indicates the point at which the bar is attached. The distance from the base of the transducers to the top of the bar is a known distance. The values from the echosounder are recorded and then accounted for in post-processing. [larger version] |
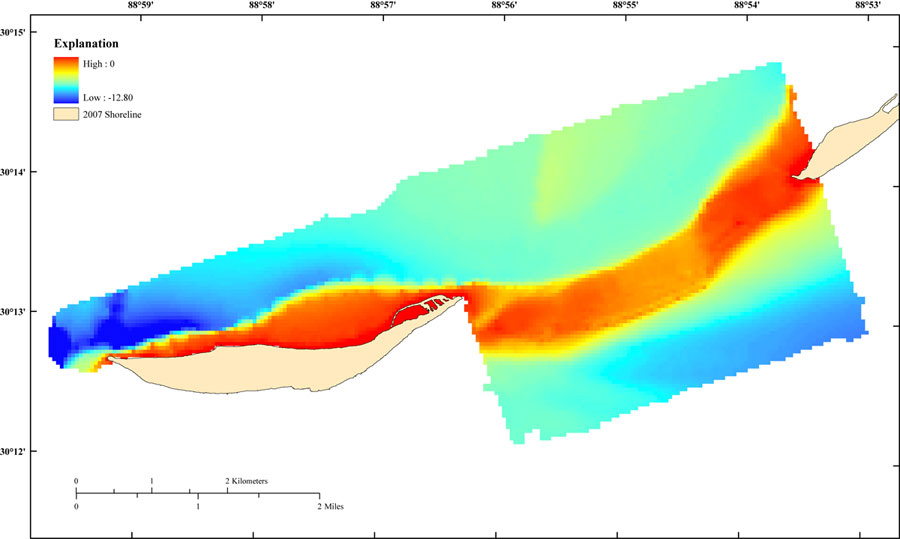
Figure 11. GeoTIFF image of the 07CCT01 gridded single-beam bathymetric data. The cell size is 50 meters, and the data range is 0 to -12.82 meters, with the positive values representing the shoreline and the negative values representing the bathymetry. Shoreline file is from 2007 processed EAARL LiDAR. [larger version] |
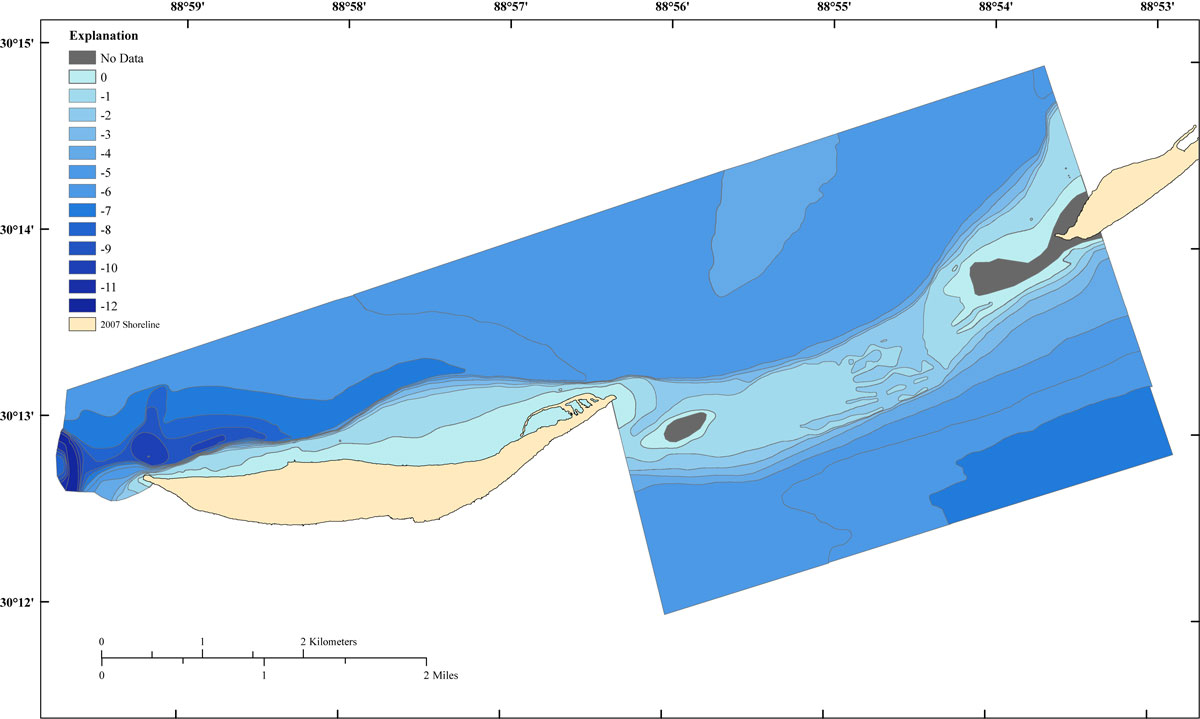
Figure 12. GeoTIFF image of the 07CCT01 50-meter gridded single-beam bathymetric data as 1-meter labeled, colored contours. Shoreline file is from 2007 processed EAARL LiDAR. [larger version] |
Tables |
Table 1. Final base station position value for FORT. This position is the weighted average of the GPS sessions that were processed with GIPSY and OPUS. |
Table 2. Crossing zone statistics, cruise 07CCT01. |
Table 3. The range of crossing zone differences displayed as percentages in relation to the total count, cruise 07CCT01. More than 90 percent of the values are <0.06 meters. |

![]() U.S. Department of the Interior |
U.S. Geological Survey
U.S. Department of the Interior |
U.S. Geological Survey
URL: http://pubsdata.usgs.gov/pubs/ds/722/html/figuresandtables.html
Page Contact Information: GS Pubs Web Contact
Page Last Modified: Monday, 28-Nov-2016 19:05:14 EST
