U.S. Geological Survey Data Series 722
The 2007 bathymetric survey was patterned after the System for Accurate Nearshore Depth Surveying (SANDS), a single-beam acoustic (sounding) Global Positioning System (GPS)-based hydrographic system developed by the USGS for shallow-water mapping (Hansen, 2008). SANDS differs from conventional bathymetric surveys in that it references bathymetric measurements to GPS rather than water depth. The objective of SANDS is to concurrently acquire GPS data sessions that yield a differentially corrected navigation file which is used to process high-resolution bathymetric measurements. This requires a base station occupying a known benchmark on land (the base) and an equivalent GPS receiver on the survey vessel (the rover) in which both receivers are simultaneously recording the positioning signal from the Navigation Signal Timing and Ranging (NAVSTAR) GPS satellite constellation (fig. 3). To keep differential position error as low as possible, the acquisition practices of SANDS adhere to guidelines. These include but are not limited to: (1) using benchmarks rated as high vertical order for base position control; if such benchmarks are unavailable, more base occupation time is allotted to help ensure that the post-processed base positional accuracy is centimeter-level or less; (2) keeping the distance between the base and roving vessel to within 20 km or less; (3) surveying several crossing lines for quality control; and (4) post-processing all GPS receiver data as opposed to using the real time kinematic (RTK) methods. The processing segment of the SANDS component is twofold. The first step is post-processing the GPS sessions (base to the rover), which yields the differentially corrected navigation file. The second part of SANDS is a stand-alone program which first applies a GEOID model to the differential navigation and then geometrically corrects the depth data using time and boat motion. The output is high-precision x,y,z data in orthometric height.
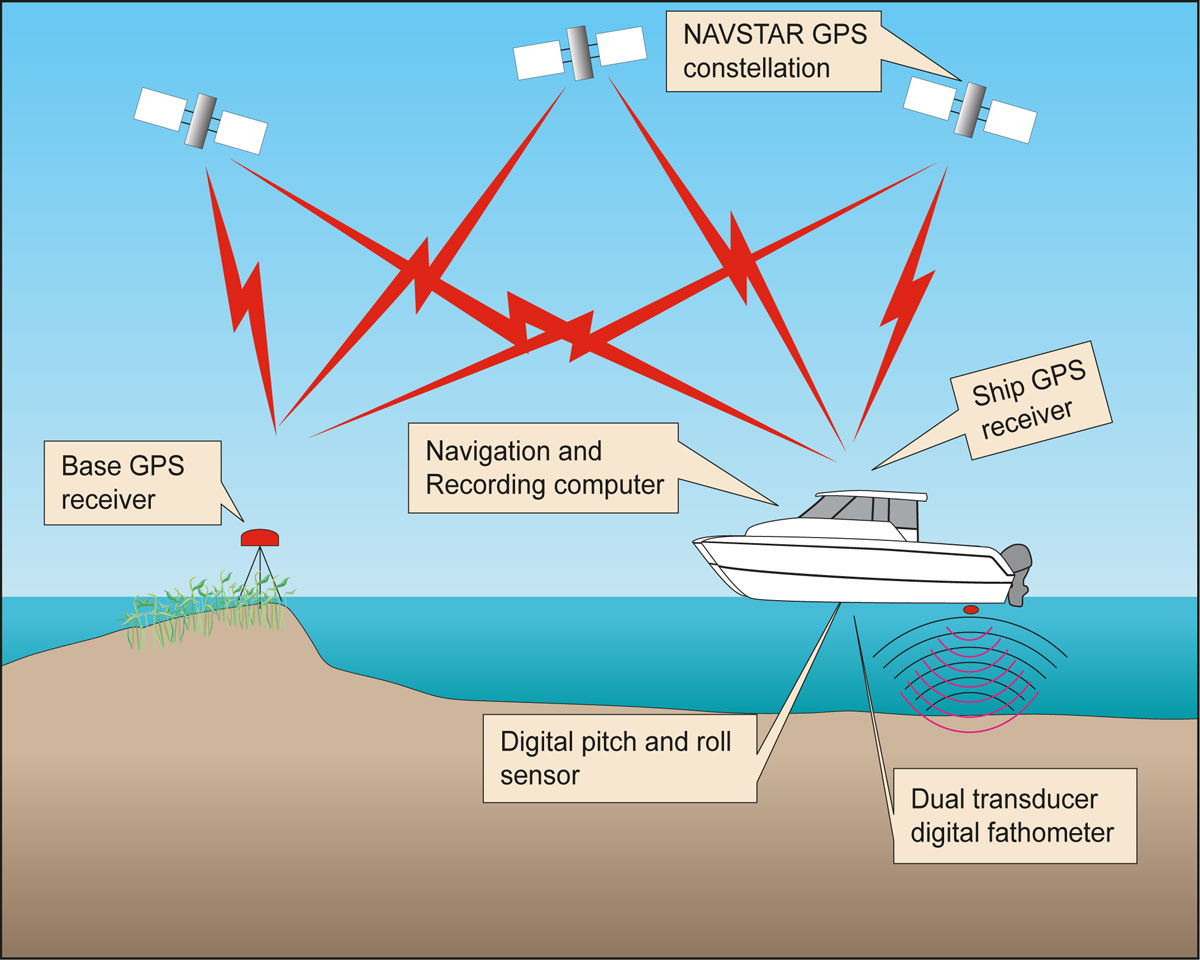
Figure 3. Diagram of SANDS data acquisition showing land-based GPS station (base) and ship-board receiver (rover). [larger version] |
Temporal changes in wind speed and direction and tidal-set fluctuations influence the sea surface by pushing water into or out of a basin, causing water level to increase or decrease. If these conditions persist during a bathymetric survey, they may introduce biased depth measurements that reflect the current conditions rather than represent the actual water depth under typical sea surface conditions.
GPS provides a more accurate way of representing water depth. GPS is based upon the earth-centered coordinate system called the World Geodetic System of 1984 (WGS84) for horizontal positioning and vertical positioning. Earth-centered systems reference all points on the Earth's surface relative to a theoretical centroid of the Earth and are globally applicable. The most common modern horizontal datum in North America is the North American Datum of 1983 (NAD83), which is based upon the GRS80 ellipsoid. The precursory earth-centered ellipsoid to WGS84 was the Geodetic Reference System of 1980 (GRS80). For all survey techniques, there was not a direct conversion of horizontal positions to NAD83, as it is assumed WGS84 sounding positions are also relative within millimeters to GRS80/NAD83(Schwarz, 1989; Hooijberg, 1997).
Vertical positions referenced to earth-centered systems are referred to as ellipsoid heights. Using earth-centered reference systems for the vertical component eliminates the need to reference bathymetric data to water levels (tide gages). This is a more accurate measurement because every processed data point has a high-precision x,y,z value that is not interpolated over time. For example, if GPS data and depth values are acquired every second, this gives an x,y,z value every second. A local tide gage may only record water level data every 15 minutes or hour. If these tide data are applied to a bathymetric survey, then all the bathymetric values recorded in between the measurement of the water-level record have to be interpolated.
A minor disadvantage to using an ellipsoid for vertical reference over mean sea level (MSL) is that conversion from standard formats such as North American Vertical Datum of 1929 (NAVD29) and North American Vertical Datum 1988 (NAVD88) to water-level-based datums (for example, MSL, or mean lower low water (MLLW)) is a more involved process. Vertical difference estimates or numerical models must be utilized for the conversion and thus may introduce bias errors into the final elevation.
In theory, the error between the base and the rover increases exponentially per kilometer from the base station (Waypoint Consulting, Inc., 2000, 2005), as reflected by an increase in the Root Mean Square (RMS) error of the differentially corrected external navigation file. To increase the positional accuracy for this survey, GPS base stations were erected within approximately 15 to 20 km of the survey areas. Efforts were made to utilize pre-existing National Geodetic Survey (NGS) benchmarks on the island. Two NGS benchmarks were occupied during this study. The primary base was NGS PID# BH1894, station designation FORT, located atop Fort Massachusetts. The secondary NGS benchmark, PID# BH0866, station designation 874 3735 TIDAL 2 1976, was located at Point Cadet Marina in Biloxi (fig. 4). The secondary base was used as backup. Ashtech Z-Xtreme GPS receivers with internal data cards recorded the 12-channel full-carrier-phase positioning signals (L1/L2) from the satellites via the Thales choke-ring antenna (fig. 5). This GPS instrument combination was duplicated on the survey vessel (rover). The base GPS receiver and the rover receiver recorded their positions concurrently at 1-second (s) recording intervals throughout the survey period.
By eliminating the use of the water level datum, the reliability of the system shifts to the GPS antenna and its capability of high-recording quality data. Atmospheric conditions can degrade the signal from the NAVSTAR satellites, so efforts were taken to not survey during storms or periods of heavy cloud cover (fig. 3). Percent Dilution of Position (PDOP) is a measure of the satellite signal strength. PDOP values can range from 1 to greater than 20 (the lower the value the better the GPS accuracy), and anything under 3 is considered excellent quality. When the PDOP value read 3 or higher, survey operations were suspended until the PDOP decreased.
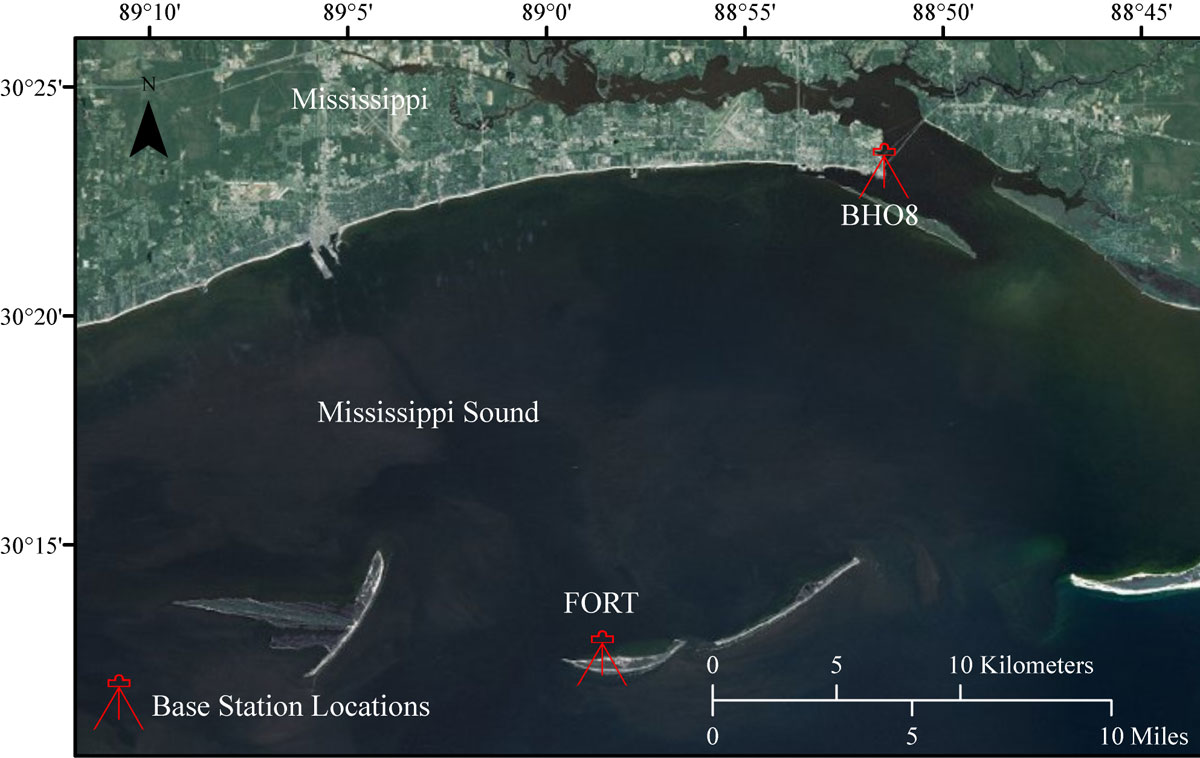
Figure 4. Map showing GPS base station locations for the 2007 survey. The site names and their affiliations are as follows: BH08 (NGS PID# = BH0866) and FORT (NGS PID# = BH1894 ). [larger version] |
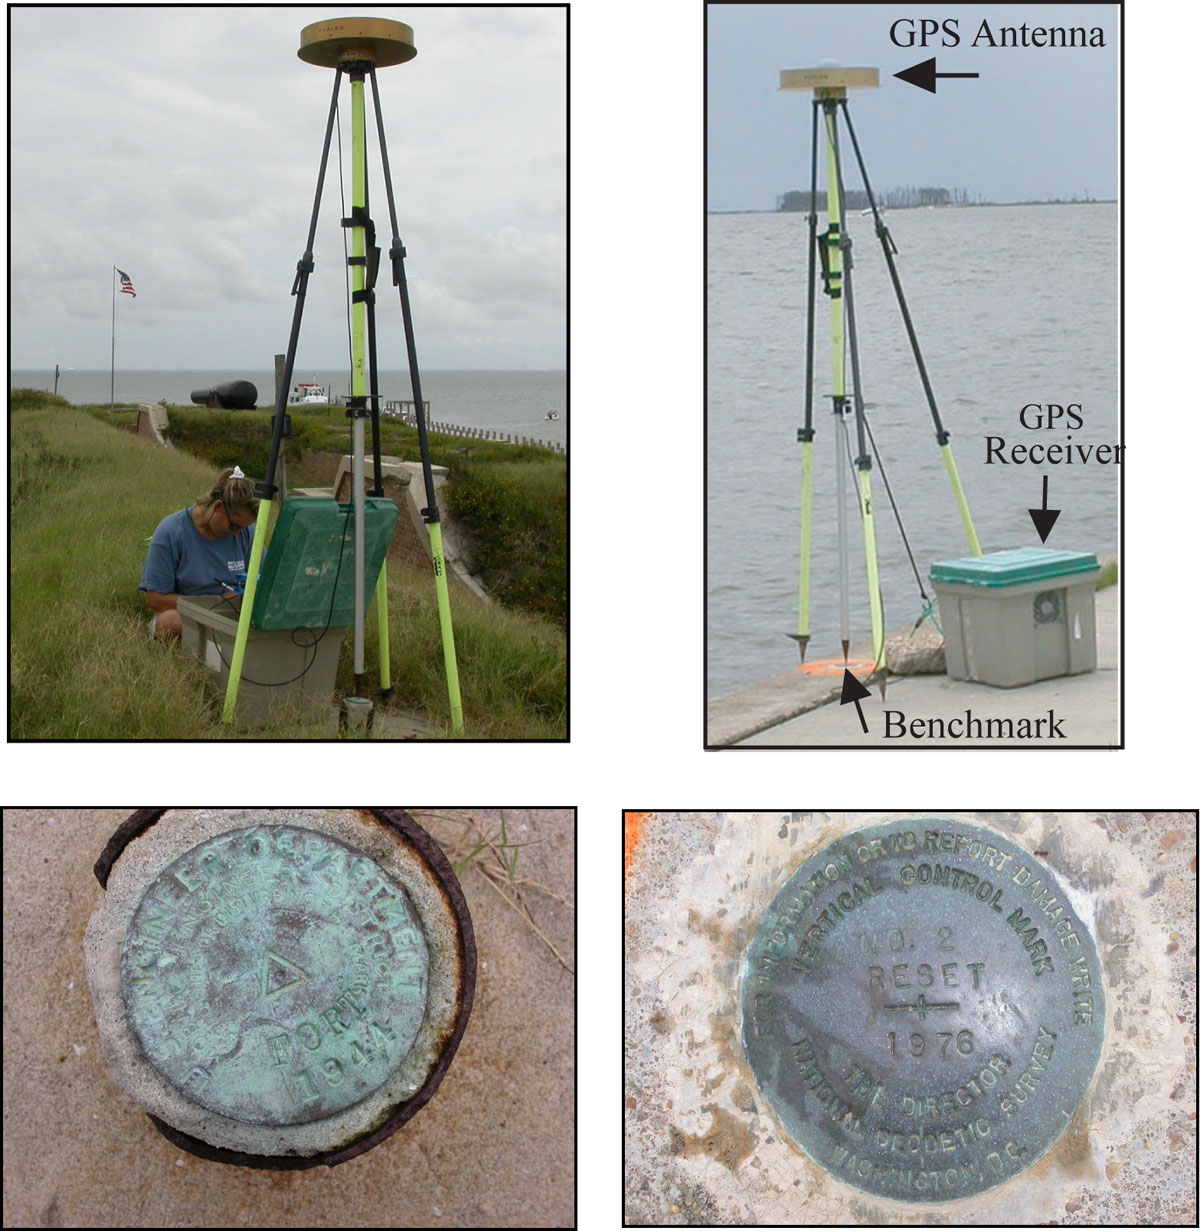
Figure 5. Photographs of the GPS base stations and their components. From left to right, FORT, atop Fort Massachusetts on West Ship Island, and BH08, located on the seawall at Point Cadet Marina in Biloxi, Mississippi. [larger version] |
The GUIS suggested surveying two areas located around Ship Island: (1) the nearshore north of Fort Massachusetts and (2) within Camille Cut. These are considered high-priority areas of concern to the GUIS because of the historical significance of the Fort and also the structural integrity of the islands with respect to Camille Cut. The planned tracklines were based upon NOAA Nautical Chart 11373. The nearshore north of Fort Massachusetts consisted of 33 tracklines spaced 125 meters (m) apart, beginning from the eastern edge of Ship Island Pass Channel, extending eastward along the island, and ending just beyond the Fort. For coverage within Camille Cut there were 18 tracklines spaced 125 m apart, extending eastward from the eastern tip of West Ship Island, ending at the east side of East Ship Island as well as covering the full extent of the cut in the north-south direction. Shoreline transects were also acquired for both areas as close to the surf zone as conditions allowed (fig. 6).
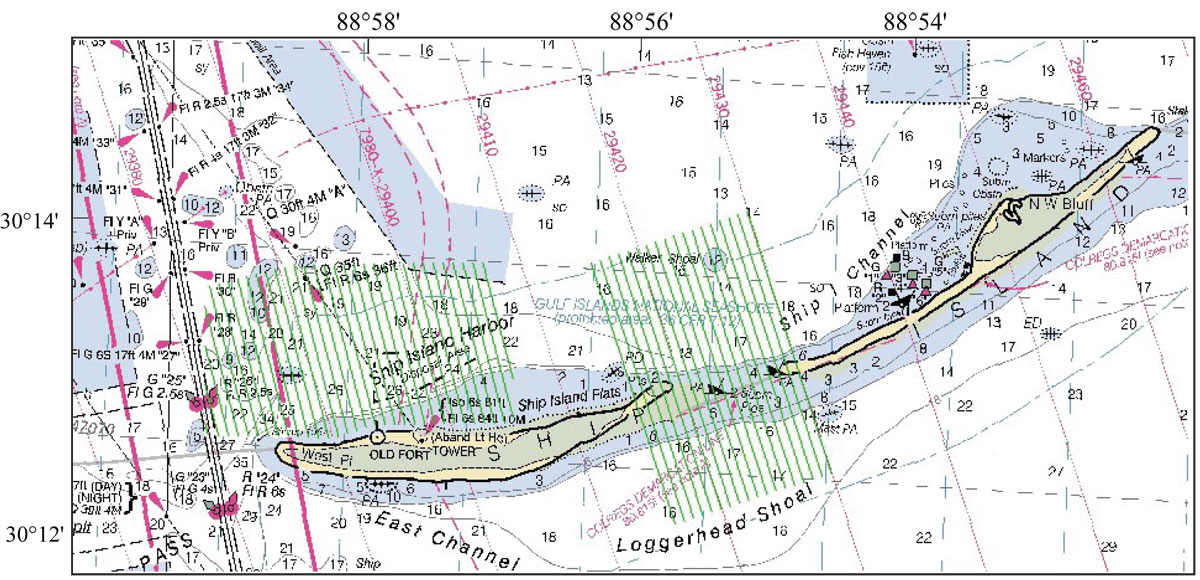
Figure 6. The planned tracklines (green lines) for USGS cruise 07CCT01, showing the area north of Fort Massachusetts and Camille Cut, overlain upon the digital NOAA Nautical Chart 11373. [larger version] |
During the survey it became obvious that the shape and width of Camille Cut were substantially different than shown on the nautical chart. To accommodate the wider cut an additional 18 lines were added at 125 m spacing, with the last four spaced at 250 m. The additional time spent in Camille Cut detracted from the Fort Massachusetts area and therefore required a redesign resulting in 23 lines at 250 m spacing occupying the majority of the original area but now connecting to the Camille Cut segment. The redesign resulted in 97 surveyed lines, including crossings and shorelines, for a total distance of 221 km (fig. 7).
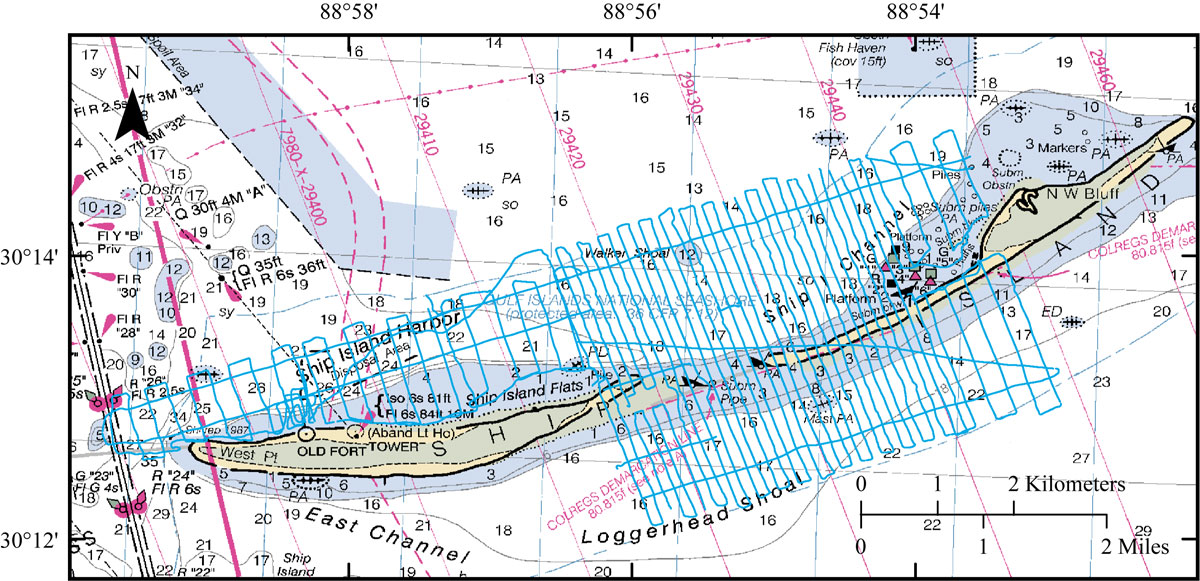
Figure 7. The surveyed tracklines (blue lines) for USGS cruise 07CCT01, which show that Camille Cut at the time of the survey was considerably larger than what was indicated on NOAA Nautical Chart 11373. [larger version] |

![]() U.S. Department of the Interior |
U.S. Geological Survey
U.S. Department of the Interior |
U.S. Geological Survey
URL: http://pubsdata.usgs.gov/pubs/ds/722/html/position_nav.html
Page Contact Information: GS Pubs Web Contact
Page Last Modified: Monday, 28-Nov-2016 19:05:11 EST