|
Introduction
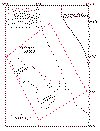
The Manchas Interiores and Manchas Exteriores is a live reef complex off the city of
Mayagüez, western Puerto Rico (Fig. 1). This reef complex may be
affected by sewage discharge from the nearby Mayagüez regional water treatment plant. The
Río Grande de Ańasco empties into this area, carrying a significant load of suspended
sediment and contaminants that may further stress the marine community. In order to
adequately assess the relative significance of the different sources of reef stress, a
program was initiated to monitor the sediment and water-quality characteristics of the
Río Grande de Ańasco in addition to sampling of effluent, ocean water, and sediment in
the vicinity of the outfall and over the coral reef. In support of this effort, a
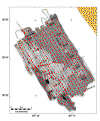
high-resolution sidescan-sonar and seismic-reflection survey was conducted in December,
1990, over the reef complex using the research vessel JEAN A in order to provide
a geologic framework, or base map, for the offshore component of the program. These
sea-floor mapping data were originally reported in Schwab and others
(1991). In this report, we present the sidescan-sonar imagery, grain-size analyses of
sediment samples, and a preliminary interpretation of the data in digital form.
Methods
The sidescan-sonar survey was conducted using a Klein model 531, 100 kHz system; total
swath width per trackline was 200m with the along track resolution of ~0.25m. The sidescan
data were logged digitally using a QMIPS data-acquisition system (Danforth
and others, 1991) at a sampling rate that resulted in a 0.1 m pixel size in the across
track direction. The data were then decimated to a 0.4 m pixel size using a median
filtering routine developed by Malinverno and others (1990) and
were processed and mosaicked in the field using procedures developed by Danforth (1997). This mosaic (Schwab and others,
1991) was used as a base map for the subsequent sampling phase of the investigation.
The sidescan data were further processed using routines developed by Chavez
(1986) as modified by Paskevich (1992) for application to
high-frequency sidescan-sonar imagery. Digital mosaicking was accomplished using the PCI
Remote Sensing software package as described by Paskevich (1996).
This dataset was mapped at a resolution of 1m/pixel in a UTM zone 19 projection using the
WGS84 ellipsoid. Darker tones on the sidescan-sonar images represent areas of relatively
low acoustic-backscatter intensity and lighter tones, areas of high backscatter (Fig. 2).
Concurrent with the acquisition of the sidescan-sonar imagery, approximately 89 km of
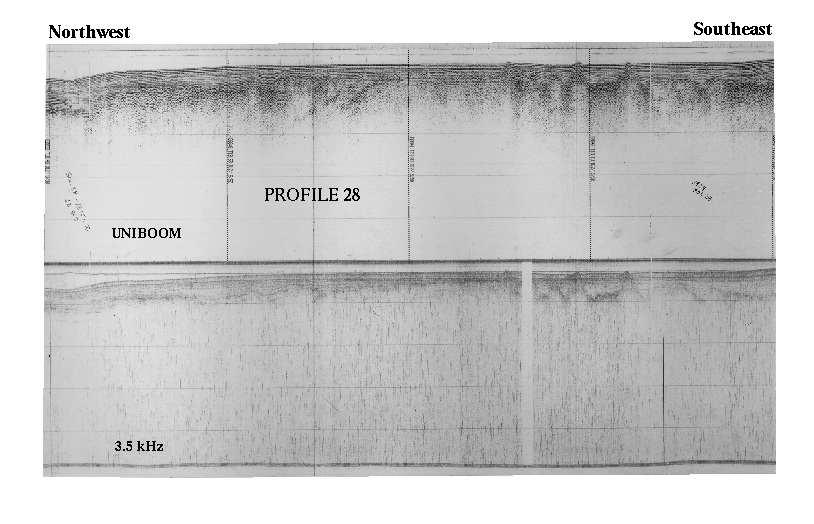
3.5 kHz and Huntec Boomer seismic-reflection profiles were collected. These data
were recorded using an analog Raytheon recorder. The original profiles are archived at the
U.S. Geological Survey, Woods Hole, MA 02543. The ship tracklines overlain on the
sidescan-sonar mosaic are presented in Figure 3. The bathymetry presented is derived from analysis of the 3.5 kHz
profiles.
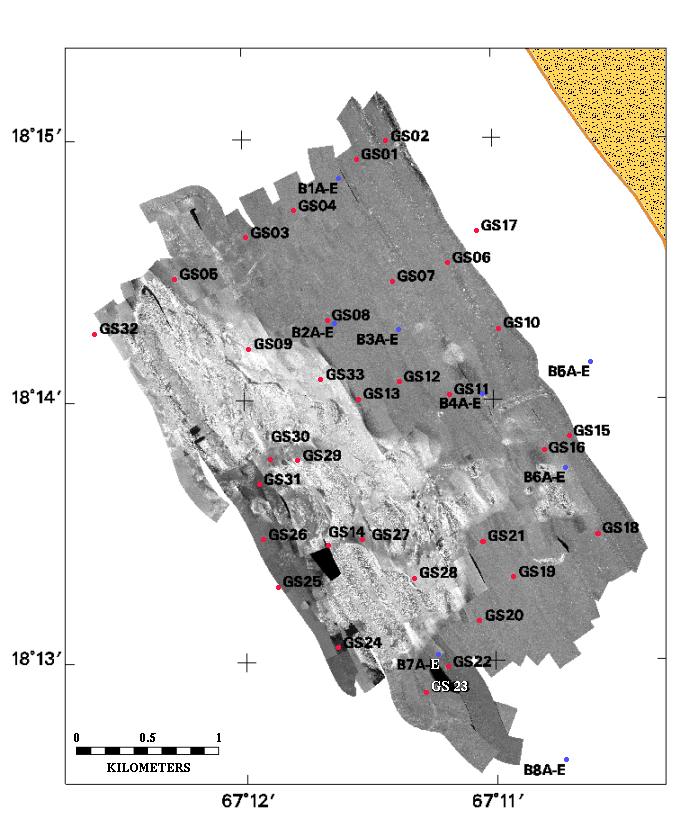
Bottom sediment samples were obtained in the study area using a Shipek grab sampler (see Fig. 5 and Table 1 for sample locations).
Sediment samples collected at stations B1 through B8 (five samples collected at each
station; A through E) were used for biologic analysis. Sediment textural analysis was
conducted using a Coulter Counter following the methodology of Poppe and
others (1985). Results of this textural analysis are presented in Table
1 (sediment type is described using the class limits of Shepard, 1954).
Ship navigation utilized a shore-based Miniranger transponder system (Schwab
and others, 1991). Using these navigation data, the seismic-reflection profiles and
bottom sample locations are accurate to within 5 m. The sidescan towfish, however, was not
navigated independently of the ship, thus, an approximate additional error of up to 15 m
exists along-track in the sidescan imagery. This additional error is attributed to the
layback of the sidescan towfish relative to the ship's position. This distance
remained relatively constant throughout the survey (Schwab and others,
1991).
The digital mosaic completed in PCI was exported as a TIFF (raster) image with
accompanying georeferencing information in a separate file (a TIFF world file). This
combination of image file and georeferencing file allows the sidescan mosaic to be
imported and geographically registered in a geographic information system such as
ARC/INFO. The imported image can be converted to a grid so that further analysis of the
mosaic can be performed based on the sidescan-sonar DN values.
In addition to the sidescan-sonar data, the sediment sample locations and analyses, ship
tracklines, sidescan interpretive map, and bathymetric contours have all been converted to
the ARC/INFO format. These files may be obtained from Openfile Report 98-427.
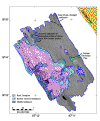
Geologic Framework of the Study Area
The level of relative acoustic backscatter intensity on a sidescan-sonar image is a
function of, among other things, the sea-floor topography, roughness, and composition (e.g., Reed and Hussong, 1989). The Manchas Interiores-Manchas Exteriores
reef complex is represented on the sidescan mosaic as an area of relatively
high-backscatter intensity (Fig. 2 and Fig. 6).
Areas of relatively low-backscatter intensity within the reef complex represent either
acoustic shadows or areas where the reef is covered by a thin veneer of sediment (Fig. 2 and Fig. 6). The reef complex is built
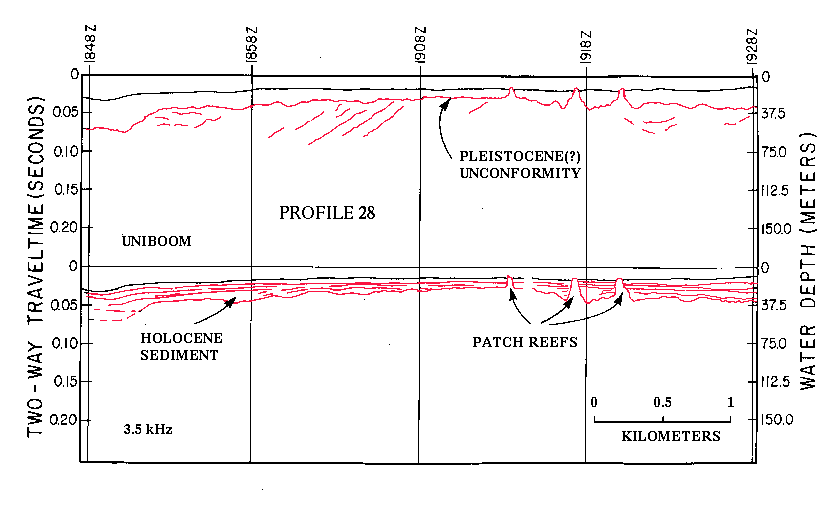
on a regional Pleistocene (?) unconformity that is displayed on the seismic-reflection
profiles (Fig. 7).
Sediment samples collected east (inshore) of the reef complex are dominantly clayey silt
and silty clay. This sedimentary deposit is represented on the sidescan mosaic as an area
of relatively low backscatter intensity (Fig. 2 and Fig. 6). High backscatter "blotches" on the sidescan mosaic
are due to large amounts of anthropogenic and biologic (?) debris in the water column;
probably related to the plume of suspended sediment originating from the Río Grande de
Ańasco. This suspended sediment plume encroached on the reef complex during this survey.
The muddy sedimentary deposit east of the reef complex, thought to be derived primarily
from the Río Grande de Ańasco, blankets a Pleistocene (?) unconformity and thins from
approximately 30 m thick in the northeast segment of the study area near the mouth of the
Río Grande de Ańasco to less than 8 m thick over an arch in the unconformity between
latitudes 18°14.5’N and 18°14.0’N (Fig. 7 and Fig. 8). In the extreme northeast segment of the sidescan-sonar
mosaic (closest to the mouth of the Río Grande Ańasco), an area of relatively low
backscatter is interrupted by blotchy high-backscatter returns. These high-backscatter
returns are also from material in the water column (Fig. 2 and Fig. 6). Seismic-reflection profiles collected over this area show
evidence of gas-charged sediment; blanking of internal reflectors on the
seismic-reflection profiles. Thus, the acoustic "noise" from the water column
displayed on the sidescan imagery off the mouth of the Río Grande de Ańasco may be
partly due to degassing of sediment, common in other deltaic settings (Coleman
and others, 1982). Additional acoustic artifacts are visible in the northern part of
the sidesan imagery and are noted on Figure 6.
The remaining sediment type, sandy reef-derived sediment, was sampled off the northeast
and northwest margin of the reef complex and within channels that run through the reef.
This sediment type typically has a relatively higher backscatter intensity than the muddy
sedimentary deposit. Along the northeast margin of the reef complex, a poorly developed
moat has formed, probably in response to storm-induced water flow (Fig.
4 and Fig. 6). A minor moat may also exist along the southern
margin of the reef complex (Fig. 4 and Fig. 7).
One gravelly sand sample, GS28, was rather unusual in that it was composed of a mixture of
reefal and terrigenous material. These sandy deposits are interpreted to be lag deposits
that are formed by storm-surge-induced currents which flow through the channels in and
around the margins of the reef complex (Schwab and others, 1991).
Although no clear evidence of active faulting was observed on seismic-reflection profiles
(faults offsetting the sea floor), the trend of the northeastern margin of the reef
complex is approximately N65°W, which is subparallel to the major structural lineaments
observed in adjacent onshore areas (Case and others, 1984). Thus, the
morphological development of the reef complex may have been controlled by the local
basement structure.
Acknowledgements
The success of this project was based on the broad range of technical support provided by
the U.S.G.S. Coastal and Marine Geology Program and Puerto Rico Water Resources Division.
Technical support of offshore surveys was provided by Thomas O'Brien, William Danforth,
Barry Irwin, Juan Trías, Milton Carlo, and Rafael Rodríguez. The digitized bathymetry
was furnished courtesy of Richard M.T. Webb of the Puerto Rico Water Resources Division.
Helpful reviews of the manuscript were provided by William Danforth, Rob Thieler and Jane
Denny. In addition, we appreciate the cooperation of the captain and crew of the research
vessel JEAN A, provided by the Department of Environmental and Natural Resources,
Commonwealth of Puerto Rico.
References
Case, J.E., Holcombe, T.L., and Martin, P.G., 1984, Map of geologic
provinces in the
Caribbean region: Geological Society of America Memoir 162, p. 1-30.
Chavez, P.S., 1986, Processing techniques for digital sonar images
from GLORIA:
Photogrammetric Engineering and Remote Sensing, v. 52, p. 1133-1145.
Coleman, J.M., Prior, D.B., and Garrison, L.E., 1982, Subaqueous
sediment instabilities in the
offshore Mississippi River Delta: Environmental Information On Hurricanes
Deep Water
Technology, and Mississippi Delta Mudslides in the Gulf of Mexico, Bureau of
Land
Management Open-File Report 80-02, p. 1-49.
Danforth, W.W., 1997, Xsonar/Showimage: A Complete System for
Rapid Sidescan Sonar
Processing and Display: U.S. Geological Survey Open-File Report 97-686, 77p.
Danforth, W.W., O’Brien, T.F., and Schwab, W.C., 1991, USGS Image processing
system:
near real-time mosaicking of high-resolution sidescan-sonar data: Sea
Technology, January
1991, p. 54-59.
Malinverno, A., Edwards, M., and Ryan, W.B.F., 1990,
Processing of SeaMARC swath sonar
data: IEEE Journal of Oceanic Engineering, vol. 15, p. 14-23.
Paskevich, V., 1992, Digital mapping of side-scan sonar data
with the Woods Hole Image
Processing System software: U.S. Geological Survey Open-File Report 92-536,
87p.
Paskevich, V., 1996, MAPIT: An improved method for mapping digital sidescan sonar data
using the Woods Hole Image Processing System (WHIPS) Software: U.S.
Geological Survey
Open-File Report 96-281, 73p.
Poppe, L.J., Eliason, A.H., and Fredericks, J.J., 1985, APSAS - an
automated particle size
analysis system: U.S. Geological Survey Circular 963, 77 p.
Reed, T.B., and Hussong, D., 1989, Digital image processing
techniques for enhancement and
classification of SeaMARC II sidescan sonar imagery: Journal of Geophysical
Research, vol.
94, p. 7469-7490.
Schwab, W.C., Webb, R.M.T., Danforth, W.W., O'Brien, T.F., and
Irwin, B.J.,
High-Resolution Sidescan-Sonar Imagery of the Manchas Interiores - Manchas
Exteriores
Coral Reef Complex, Mayagüez, Puerto Rico: U.S. Geological Survey Open-File
Report
91-436.
Shepard, F.P., 1954, Nomenclature based on sand-silt-clay ratios:
Journal of Sedimentary
Petrology, vol. 24, p. 151-158.
|