National Assessment of Coastal Vulnerability to Sea-Level Rise: Preliminary Results for the U.S. Pacific Coast
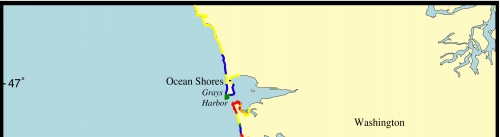
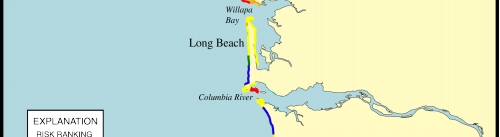
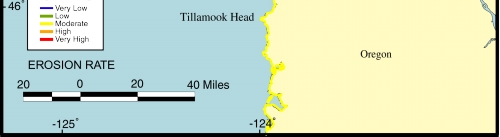
Figure 7. Map of the shoreline erosion/accretion rate variable for southwestern Washington and northwestern Oregon. The smaller-scale variations in the C.V.I. values (see Figure 4) are influenced primarily by changes in shoreline erosion rate. |