National Assessment of Coastal Vulnerability to Sea-Level Rise: Preliminary Results for the U.S. Pacific Coast
Discussion: Tillamook Head, Oregon, to Ocean Shores, Washington, Region

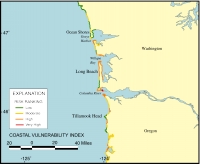
| Figure 4. Map of the Coastal Vulnerability Index for the open ocean coast of southwestern Washington and northwestern Oregon. |
|

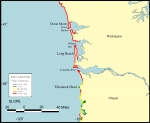
Figure 5. Map of the coastal slope variable for southwestern Washington and northwestern Oregon.
|
|

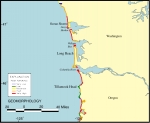
Figure 6. Map of the geomorphology variable for southwestern Washington and northwestern Oregon.
|
|

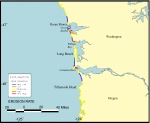
Figure 7. Map of the shoreline erosion/accretion rate variable for southwestern Washington and northwestern Oregon.
|
|
|
The Coastal Vulnerability Index (C.V.I.) values near Tillamook Head, Oregon indicate a low vulnerability to future sea-level rise (Figure 4). To the north, however, the C.V.I. values increase to a "very high" ranking. Three variables (tide range, rate of sea-level rise, wave energy) provide a relatively uniform "background" vulnerability for this region, since they have consistent values over the entire region. The change in C.V.I. ranking is thus reflected primarily in the remaining three variables: coastal slope, geomorphology and erosion rate. The regional coastal slope diminishes greatly to the north of Tillamook Head (Figure 5). Whereas at Tillamook Head the coastal slope is very steep, the slope decreases at the Columbia River entrance and along the beaches to the north. Similarly, the geomorphology at Tillamook Head -- cliffs and rocky headlands -- is ranked as low vulnerability, whereas to the north the sandy beaches of Long Beach and Grays Harbor are ranked as high and very high vulnerability, respectively (Figure 6). Finally, this region of the Washington/Oregon coast has a spatially varying erosion rate that is also well-documented. Tillamook Head is stable (neither eroding nor accreting more than 1.0 m/year); to the north, the erosion rate data indicates both rapidly eroding and accreting coastlines are present around the Columbia River mouth (Figure 7).
|
