National Assessment of Coastal Vulnerability to Sea-Level Rise: Preliminary Results for the U.S. Pacific Coast
Discussion: San Francisco and Monterey Bay Region
Click on map for larger image with caption.
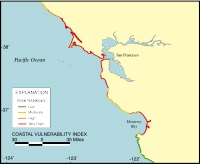
| Figure 8. . Map of the Coastal Vulnerability Index for the San Francisco - Monterey region. |
|
|
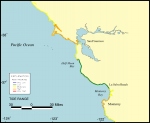
Figure 9. Map of the tide range variable for the San Francisco - Monterey region.
|
|
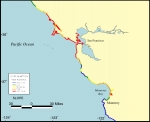
Figure 10. Map of the coastal slope variable for the San Francisco - Monterey region. |
|
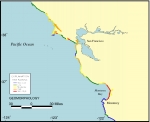
Figure 11. Map of the geomorphology variable for the San Francisco - Monterey region. |
|
The San Francisco and Monterey Bay areas reflect variability in Coastal Vulnerability Index (C.V.I.) rankings that is quite different from the regions to the north, with high susceptibility to the north decreasing to lower susceptibility south of Monterey Bay (Figure 8). In the San Francisco - Monterey Bay region relative sea-level is rising at 2.29 mm/yr. In contrast to the northern Pacific coast, wave energy here is moderate to high and decreases to low towards southern California. Similarly, the variation in tide range yields larger scale variability (Figure 9). The erosion rate data for this region is poorly documented, with the entire region classified as stable. In contrast to the Tillamook Head area, the combination of two moderate ranks (erosion rate and wave energy) and one high vulnerability ranking (rate of sea-level rise) gives the region a "background" of high vulnerability.
As in the Washington/Oregon region, the variables that provide the variability to the index in this region are geomorphology and coastal slope. In general, the coastal slope and the geomorphology closely mimic each other. The cliffed rocky headland at Monterey has a very steep coastal slope. Within Monterey Bay, however, the sandy beach has a low coastal slope (Figure 10). In the San Francisco region, the geomorphology variable reflects rocky headlands interspersed with sandy beaches (Figure 11). The regional coastal slope, however, is very low along the open ocean coast. Within the San Francisco region the relatively low coastal slope adds weight to the index, whereas the geomorphology adds alongshore variation. Thus, the combination of high risk associated with coastal slope, erosion rate, and geomorphology leads to a much higher overall vulnerability ranking than the areas in the Pacific Northwest.
|
