National Assessment of Coastal Vulnerability to Sea-Level Rise: Preliminary Results for the U.S. Gulf of Mexico Coast
Discussion
The data variables underlying the C.V.I. show variability at several spatial scales. The geomorphology and tide range vary over a spatial scale of >500 km. For geomorphology, this lack of variability represents the large-scale, rather uniform patterns of landform type along the Gulf coast (Figure 4). Barrier islands, lagoons, marshes and deltas dominate the coast, which are landforms that have a very high risk ranking (see Table 1). In addition, the entire coast is microtidal; thus, this variable yields a very high risk ranking (Figure 5).
Click on map for larger image 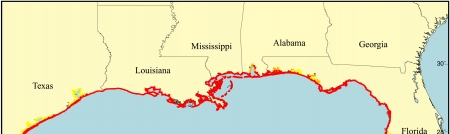 |
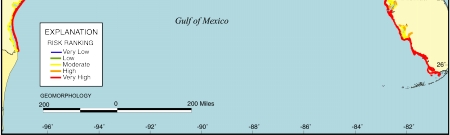 Figure 4. Map of the geomorphology variable for the U.S. Gulf of Mexico coast. The shoreline is composed predominantly of very high-risk barrier island complexes, lagoons, marshes and deltas. |
A second group of variables, consisting of relative sea-level rise and wave height, vary on a ~200 km spatial scale. For example, the low-energy Gulf of Mexico coast has mean wave heights that on average are ~0.5 m (Figure 6), and vary between only 0.07 m and 1.04 m.
Changes in relative sea-level rise are greatest around New Orleans, Louisiana, where the rates can be as much as 10 mm/yr (Figure 7). East of Louisiana, the rate of relative sea-level rise is ~ 2 mm/yr. This lower value, however, is still higher than the modern rate of eustatic rise (1.8 mm/yr), which reflects the ongoing recent subsidence of this region. To the west of Louisiana, rates of relative sea-level rise are also lower, decreasing to the 3-5 mm/yr range, which again is well above the modern eustatic rate and still within the very high risk range of our rating system. These high rates of relative sea-level rise within and surrounding Louisiana are primarily due to the natural compaction of the Holocene deltaic sediments in the Gulf of Mexico (Penland and Ramsey, 1990; Turner, 1991).
The coastal slope variable changes on a ~ 50 km spatial scale (Figure 8). The areas with the lowest slope are those surrounding the Mississippi delta. These data show slopes of less than 0.02%. The highest slopes along the Gulf of Mexico coast are found south of Corpus Christi, Texas, along the Florida panhandle, and in the greater Tampa-St. Petersburg, Florida region. While these values of slope yield a moderate to low susceptibility ranking, they are only in the 0.5% range, and thus are not steep slopes in an absolute sense.
In some cases, the data describing erosion and accretion rates vary on a small spatial scales of about 5 km, but most of the variation in erosion rates varies on the ~20 km scale. There are long sections of coastline (~150 km), however, that show little to no variation in erosion rates (Figure 9), both because of an actual lack of change as well as an absence of comprehensive erosion rate data.
The C.V.I. rankings for the Gulf of Mexico coast are governed by the large-scale variations of its variables (Figure 1). The CVI shows a regional distinction centered on the New Orleans region. From the very high vulnerability New Orleans region to the west, the CVI rankings remain as high vulnerability along the coast with lower vulnerability in the inland bays. To the east of New Orleans, the CVI values decrease to moderate. The one exception to this trend is Appalachicola Bay, Florida, which due to its high erosion rates, low slope, and moderate rate of sea-level rise receives a very high susceptibility ranking. The regional variation of higher vulnerability to the west and lower vulnerability to the east is controlled by the mean wave height, the relative sea-level rise and to some extent the coastal slope.
The CVI shows that the region around New Orleans is the most vulnerable of all areas along the Gulf of Mexico coast. The Florida panhandle, as well as the West Florida coast, are considered to be at low to moderate risk, primarily because of the lower rates of relative sea-level rise, lower mean wave heights, and a relatively higher coastal slope in this region. The Texas coast is considered to be at a high to very high risk because of the relatively high mean wave height and relative sea-level rise vulnerabilities.
|