
Probability Models for Estimation of Number and Costs of Landslides
by Robert A. Crovelli1
Open-File Report 00-249
2000
This report is preliminary and has not been reviewed for conformity with U.S. Geological Survey editorial standards or with the North American Stratigraphic Code. Any use of trade, firm, or product names is for descriptive purposes only and does not imply endorsement by the U.S. Government.
U.S. DEPARTMENT OF THE INTERIOR
U.S. GEOLOGICAL SURVEY
1U.S. Geological Survey, MS 939, Box 25046, Denver Federal Center, Denver, Colorado 80225
Abstract
The objective of this report is to describe the development of probability models for estimation of the number and costs of landslides during a specified time. Important philosophical ideas about natural processes and probability models are presented first. Then two probability models for the number of landslides that occur during a specified time are investigated: a continuous-time model (Poisson model) and a discrete-time model (binomial model). Estimation theory is developed for the estimation of the parameters of both of the models. The exceedance probability of one or more landslides during a specified time is formulated for both models. The estimation theory and probability formulation of the Poisson model are applied to the future occurrence of landslides in Seattle, Washington, using historical data from 1909 to 1997. Theoretical and numerical comparisons between the Poisson and binomial models are conducted that show the binomial model is an approximation to the Poisson model. An economic probability model is developed as an addition to the Poisson model for the estimation of the total damage from future landslides in terms of economic loss as costs in dollars. For illustrative purposes the economic probability model is applied to damaging landslides caused by El Nino rainstorms within the winter season 1997-98 in the San Francisco Bay region, California.
Philosophy of Probability Models
Natural Processes
Important philosophical ideas about natural processes:
Probability Models
Important philosophical ideas about probability models:
In summary, hazard processes are deterministic, but because of our limitations when studying hazards, we resort to probability models that incorporate our uncertainty.
Probability Models for Landslides
Consider the occurrence of landslides during a specified time in a particular area.
Denote
N(t): Number of landslides that occur during time t in a particular area
We are interested in deriving a formula for calculating the probability of one or more landslides during a specified time t. That is,
P{N(t) ³ 1}
Two probability models for N(t) will be investigated: first, a continuous-time model and second, a discrete-time model.
Poisson Model for Number of Landslides
The Poisson model is a continuous-time model consisting of the occurrence of random point-events (landslides) in ordinary time which is naturally continuous. The Poisson model is the most commonly used model for the occurrence of random point-events in time and has been used in modeling the occurrence of earthquakes.
Assumptions of the Poisson model:
It is important to acknowledge that these assumptions may not completely hold for the occurrence of landslides, especially the independence assumption. However, given a certain lack of understanding of the physical processes that control landslides, the Poisson model represents the best first-approximation model in attempting to model their occurrence. A first-approximation model is often applied in mathematical modeling when the assumptions are not completely satisfied by the physical process. Usually the first-approximation model is relatively easy to work with and is mathematically tractable. A more accurate model might be extremely complex and not mathematically tractable.
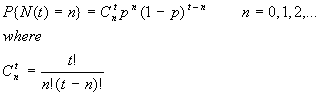
Poisson Distribution -- Probability of n landslides during time t:
![]()
where
l : Rate of occurrence of landslides
Note that time t is specified, whereas rate l is estimated.
Definition of recurrence intervals {Ti, i = 1, 2, …, n}:
T1: Time until the first landslide
Ti: Time between the (i – 1)st and the ith landslide for i > 1
Note that n landslides will have n recurrence intervals.
Theorem – Recurrence intervals {Ti, i = 1, 2, …, n} are independent identically distributed exponential random variables having mean recurrence interval (m ) equal to the reciprocal of the rate of occurrence, i.e., m = 1/l .
For landslides, the mean recurrence interval (m ) is the average time interval between landslides.
Note
l = 1/m
Variance of Ti is
V[Ti] = 1/l 2 = m 2
Probability of a recurrence interval being greater than time t
![]()
Probability of one or more landslides during time t (exceedance probability)
![]()
Note
If t is fixed and m ® ¥ , then P{N(t) ³ 1} ® 0.
If m is fixed and t ® ¥ , then P{N(t) ³ 1} ® 1.
Mean or expected value of N(t) is
E[N(t)] = l t = t/m
Note that the smaller the m , the larger the E[N(t)].
Variance of N(t) is
V[N(t)] = l t = t/m
Estimation of the Parameters l and m in the Poisson Model
A Poisson model having an unknown rate l is to be observed for a fixed time t*.
We want to determine a statistic that is a good estimator of the parameter l .
It can be shown (Ross, 1972) that the maximum likelihood estimator of l , denoted by R, is given by
![]()
Mean or expected value of R is
E[R] = E[N(t*)/t*] = l t*/t* = l
(R is an unbiased estimator of l )
Variance of R is
V[R] = V[N(t*)/t*] = l t*/(t*)2 = l /t*
Theorem – The statistic R is the unique minimum variance unbiased estimator of l .
![]() Since m
= 1/l
, a statistic that is a good estimator of the parameter m
is
Since m
= 1/l
, a statistic that is a good estimator of the parameter m
is
Consider another statistic as an estimator of the parameter m

where
Ti: The ith observed recurrence interval (i = 1, 2, …, N(t*))
Because
![]()
The estimator M¢ will tend to be biased low and underestimate m .
Example
Suppose a record of the occurrence of landslides for the past 100 years (t*) showed that 5 landslides (n) occurred.
An estimate of l would be
r = n/t* = 5/100 = 1/20 = 0.05
Hence, we expect landslides at a rate of 0.05 per year.
An estimate of m would be
m = 1/r = t*/n = 100/5 = 20
Therefore, we expect the mean recurrence interval to be 20 years.
From either of these estimates of the parameters l and m , we could calculate the probability of one or more landslides during a future time t
![]()
Using m = 20 and specifying t = 50, we get
![]()
There is a 91.8% chance of one or more landslides occur during the next 50 years.
Application
Seattle, Washington, has kept records of landslide occurrence from 1909 to present. Records from 1909 to 1997 (t* = 88.4 years) were analyzed to determine landslide density using a moving count circle approach (Coe and others, 2000). This analysis showed that n landslides occurred within each count circle, where n ranged from 0 to 30. The Poisson model was applied to these data, and the results are given in table 1.
Binomial Model for Number of Landslides
Costa and Baker (1981) give a probability model that they used in flood hazard analyses for modeling the occurrence of floods. The Costa-Baker model was also used by Keaton and others (1988) and Lips and Wieczorek (1990) in modeling the occurrence of debris flows. The Costa-Baker model was given without any derivation as follows, written in the notation of this paper:
![]()
with the mean recurrence interval m = 1/p and t is number of years
where
p: Probability of a flood in any one year
The Costa-Baker model is a crude model in that it divides time into fixed discrete increments (one-year increments). It is designed for large values of t and m .
The Costa-Baker model is actually an example of the binomial model.
The binomial model is a discrete-time model consisting of the occurrence of random point-events (landslides) in discrete time; that is, time is partitioned into a series of discrete increments of the same length and within each increment a single point-event (landslide) may or may not occur.
Assumptions of the binomial model:
Binomial Distribution -- Probability of n landslides during discrete time t:
Note that time t is specified, whereas probability p is estimated.
Definition of recurrence intervals {Ti, i = 1, 2, …, n}:
T1: Number of time increments until the first landslide
Ti: Number of time increments between the (i – 1)st and until the ith landslide for i > 1
Note that n landslides will have n recurrence intervals.
Theorem – Recurrence intervals {Ti, i = 1, 2, …, n} are independent identically distributed geometric random variables having mean recurrence interval (m ) equal to the reciprocal of the probability of success, i.e., m = 1/p.
For landslides, the mean recurrence interval (m ) is the average time interval between landslides.
Since
p = 1/m
the larger the mean recurrence interval (m ), the smaller the probability of a landslide in any one year (p). Also, if m < 1, then p > 1 which is not allowed. Therefore, the binomial model has the restriction m ³ 1.
Variance of Ti is
V[Ti] = (1 – p)/p2 = m (m - 1)
Probability of a recurrence interval being greater than time t
![]()
Probability of one or more landslides during time t (exceedance probability)
![]()
where the last expression is the Costa-Baker model.
Note that 1 – p is raised to the t power under the assumption of independence.
Mean or expected value of N(t) is
E[N(t)] = tp = t/m
Variance of N(t) is
V[N(t)] = tp(1 – p) = (t/m )(1 – 1/m )
Estimation of the Parameters p and m in the Binomial Model
A binomial model having an unknown probability p is to be observed for a fixed time t*.
We want to determine a statistic that is a good estimator of the parameter p.
It can be shown that the maximum likelihood estimator of p, denoted by F, is given by the relative frequency of occurrence
![]()
Recall
t*: Number of one-year increments
N(t*): Number of one-year increments in which a landslide occurred
Mean or expected value of F is
E[F] = E[N(t*)/t*] = t*p/t* = p
(F is an unbiased estimator of p)
Theorem – The statistic F is the unique minimum variance unbiased estimator of p.
Since m = 1/p, a statistic that is a good estimator of the parameter m is
![]()
Example
Suppose a record of the occurrence of landslides for the past 100 years (t*) showed that 5 landslides (n) occurred. Assume that the 5 landslides occur in 5 individual one-year increments.
An estimate of p would be
f = n/t* = 5/100 = 1/20 = 0.05
Hence, we expect the probability of a landslide in any one-year increment to be 0.05.
An estimate of m would be
m* = 1/f = t*/n = 100/5 = 20
Therefore, we expect the mean recurrence interval to be 20 years.
From either of these estimates of the parameters p and m , we could calculate the probability of one or more landslides during a future time t
![]()
Using m = 20 and specifying t = 50, we get
![]()
There is a 92.3% chance of one or more landslides during the next 50 years.
The Binomial Model is an Approximation to the Poisson Model
Poisson model
![]()
Binomial model
![]()
Now compare e-1/m and 1 – 1/m
Recall the exponential series
![]() Then
Then
![]()
Let
x = -1/m
Thus
1 – 1/m is equal to the first two terms of the exponential series for e-1/m .
Hence
![]()
Therefore
![]()
For a numerical comparison between the Poisson model and the binomial model see tables 2 (Poisson model) and 3 (binomial model) which give the results from the application of each model to a generic data set. The binomial model significantly over estimates the exceedance probabilities for relatively short mean recurrence intervals (a few years) and short periods of time. For example, when the mean recurrence interval is two years and the specified time is one year, the exceedance probability is equal to 50% using the binomial model, whereas it is equal to 39.3% using the Poisson model. The difference between the two models becomes negligible for longer mean recurrence intervals and longer time periods. This obviously is significant to hazards because events with short mean recurrence intervals and short time periods (less than 25 years) play a major role in determining the degree of hazard.
Theorem – The binomial distribution is an approximation to the Poisson distribution.
Given
Poisson distribution with parameters
t: Specified time (number of years)
l : Rate of occurrence of events (landslides)
Binomial distribution with parameters
n : Number of "trials" (number of time increments)
p: Probability of occurrence of a "success" (landslide) in any trial
When n tends to infinity, and p tends to zero, but means l t = n p remain constant,
then the binomial distribution approaches the Poisson distribution.
For a proof of this theorem see Walpole and Myers (1989).
Probability Model for Costs of Landslides
Damage due to landslides will be taken in the form of economic loss as costs in dollars. However, the theory below would also apply to other types of damage as in the case of human loss in deaths.
Given
![]()
where
N(t): Number of landslides that occur during time t in a particular area
N(t) has a Poisson distribution with rate l .
Xi: The amount of damage (cost) from the ith landslide
The Xi (i = 1, 2, …) are independent and identically distributed random variables which are also independent of N(t).
Y(t): The total amount of damage (costs) from all of the landslides during time t
Then
Mean or expected value of Y(t) is
m Y = E[Y(t)] = l tE[X]
Variance of Y(t) is
s Y2 = V[Y(t)] = l t{V[X] + (E[X])2}
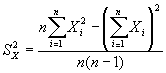
From an observed number of landslides n, the sample mean cost MX is an estimator of E[X] where

The sample variance SX2 is an estimator of V[X] where
In the case that only observed estimates of the minimum value of X, Min(X), and maximum value of X, Max(X), are available, then an estimator of the standard deviation of X would be
![]()
The divisor of 6 is based on plus and minus three standard deviations from the mean for a range of 6 standard deviations.
The Pareto probability distribution is possibly a good approximate distribution for the random variable X.
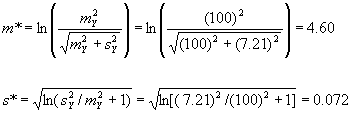
Crovelli (1992) showed that the lognormal probability distribution is a good approximate distribution for the type of random variable Y(t). Hence, the fractiles of Y(t) can be approximated by using the lognormal distribution. As derived in Crovelli (1992), the characterizing parameters of the lognormal distribution, namely mu (m *) and sigma (s *), can be calculated from the mean m Y and standard deviation s Y of a lognormal random variable Y as follows
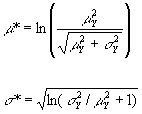
Knowing the lognormal characterizing parameters, the lognormal fractiles can be calculated from the formula
![]()
![]() Where Z is a standard normal random variable and P{Z > za
} = a
.
Where Z is a standard normal random variable and P{Z > za
} = a
.
For example, two fractiles of interest in this report are
![]()
There is a 95% chance of exceeding F95, and a 5% chance of exceeding F5. Together, the low value of F95 and the high value of F5 form a range of values that is a 90% prediction interval for Y(t), the total costs from landslides during a specified time, (at a 90% confidence level).
The reverse problem would be to find the probability of exceeding a specified amount in economic loss due to landslides in a particular area during a specified time. That is, given ya , find a such that
P{Y(t) > ya } = a
Normalizing
![]()
Now, from za , find a such that P{Z > za } = a .
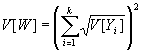
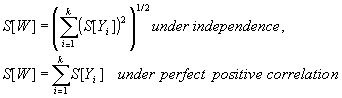
The aggregation of the total amounts of damage (costs) from landslides in k areas:
![]()
where Yi: The total amount of damage (costs) from landslides in the ith area.
Mean or expected value of W
![]()
Variance of W under the assumption of independence of the Yi
![]()
Variance of W under the assumption of perfect positive correlation of the Yi
Also, under the assumption of perfect positive correlation, the fractiles are additive. That is,
![]()
Rough rather than rigorous mathematical definitions of independence and perfect positive correlation are the following:
The normal probability distribution is a good approximate distribution for this type of random variable W because of the well-known Central Limit Theorem of probability theory.
Example
Suppose a record of the occurrence of landslides for the past year (t*) showed that 40 landslides (n) occurred.
An estimate of l would be
r = n/t* = 40/1 = 40
We expect landslides at a rate of 40 per year.
An estimate of m would be
m = 1/r = t*/n = 1/40 = 0.025
We expect the mean recurrence interval to be 0.025 years.
Suppose that from the 40 observed landslides, the sample mean cost mX = 0.5 million dollars and the sample standard deviation sX = 0.1 million dollars.
An estimate of the mean or expected value of Y(t) during the specified time t = 5 years, that is, E[Y(5)], is
mY = rt(mX) = (40)(5)(0.5) = 100
Hence, a mean estimate of the total costs from landslides during the next 5 years is 100 million dollars.
An estimate of the variance of Y(5), V[Y(5)], is
sY2 = rt(mX2 + sX2) = (40)(5)[(0.5)2 + (0.1)2] = 52
An estimate of the standard deviation of Y(5) is
sY = 7.21
Estimates of the characterizing parameters of the lognormal distribution, namely mu (m *) and sigma (s *), are
Estimates of the 95th fractile and the 5th fractile of Y(5), namely F95 and F5, are
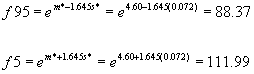
Therefore, a low estimate of the total costs from landslides during the next 5 years is 88 million dollars. There is a 95% chance of exceeding 88 million dollars. A high estimate of the total costs from landslides during the next 5 years is 112 million dollars. There is a 5% chance of exceeding 112 million dollars.
Application
The direct costs assessed to landslides for each county in the 10-county San Francisco Bay region, California, listed in Godt (1999) will be used to illustrate the probabilistic methodology developed above (see table 4). The damaging landslides were caused by El Nino rainstorms within the winter season 1997-98. An economic landslide hazard assessment of each county is performed as in the case of the previous example. Then the ten counties are aggregated for comparison under the two assumptions: independence and perfect positive correlation.
It is very important to realize that the winter season 1997-98 was an anomalous year and not representative of conditions in a typical year because the occurrence and costs of the landslides were considerably higher than normal. In actual practice a longer period of record of landslides covering multiple years and storms should be used to determine estimates of future landslide occurrence and costs. The main purpose of this application is to illustrate what could be done with the economic probability model that has been developed by using available data required by the model; the future estimates themselves are not meaningful. On the other hand, since scenario planning is becoming wide spread by various planners, it could be argued that this application might be used to represent a "worst-case scenario," and the future estimates themselves would be meaningful.
Summary
Conclusions
Acknowledgments
The author wishes to gratefully acknowledge the helpful reviews of Jeffrey A. Coe and Rex L. Baum, both in the Landslide Group of the Geologic Hazards Team at the U.S. Geological Survey.
References
Coe, J.A., Michael, J.A., Crovelli, R.A., and Savage, W.Z., 2000, Preliminary map showing landslide densities, mean recurrence intervals, and exceedance probabilities as determined from historic records, Seattle, Washington: U.S. Geological Survey Open-File Report 00-xxx, in review.
Costa, J.E. and Baker, V.R., 1981, Surficial geology – building with the earth: New York, Wiley & Sons, 498 p.
Crovelli, R.A., 1992, Probabilistic methodology for estimation of undiscovered petroleum resources in play analysis of the United States: Nonrenewable Resources, v. 1, no. 2, p. 153-162.
Godt, J.W., 1999, Maps showing locations of damaging landslides caused by El Nino rainstorms, winter season 1997-98, San Francisco Bay region, California: U.S. Geological Survey pamphlet to accompany miscellaneous field studies maps MF-2325-A-J, 13 p.
Keaton, J.R., Anderson, L.R., and Mathewson, C.C., 1988, Assessing debris flow hazards on alluvial fans in Davis County, Utah, in Fragaszy, R.J., ed., Twenty-fourth Annual Symposium on Engineering Geology and Soils Engineering: Pullman, Washington, Publications and Printing, Washington State University, p. 89-108.
Lips, E.W. and Wieczorek, G.F., 1990, Recurrence of debris flows on an alluvial fan in central Utah, in French, R.H., ed., Hydraulics/Hydrology of Arid Lands (H2AL); Proceedings of the International Symposium: American Society of Civil Engineers, p. 555-560.
Ross, S.M., 1972, Introduction to probability models: New York, Academic Press, Inc., 273 p.
Walpole, R.E. and Myers, R.H., 1989, Probability and statistics for engineers and scientists: New York, Macmillan Publishing Company, 4th ed., 765 p.
Table 5. Summary of probability models for estimation of number and costs of landslides
Poisson Model for Number of Landslides (continuous-time model)
Random variables: N(t): Number of landslides T: Recurrence interval
Probability distributions: Poisson Exponential
Parameters: l : Rate of occurrence m : Mean recurrence interval
Means or expected values: E[N(t)] = l t E[T] = m = 1/l
Standard deviations: S[N(t)] = (l t)1/2 S[T] = m
Exceedance probabilities: P{N(t) ³ 1} = 1 – e-l t P{T > t} = e-t/m
Estimators of parameters: R = N(t*)/t* M = 1/R = t*/N(t*)
Binomial Model for Number of Landslides (discrete-time model)
Random variables: N(t): Number of landslides T: Recurrence interval
Probability distributions: Binomial Geometric
Parameters: p: Probability of landslide m : Mean recurrence interval
Means or expected values: E[N(t)] = pt E[T] = m = 1/p
Standard deviations: S[N(t)] = [p(1 – p)t]1/2 S[T] = m (m - 1)
Exceedance probabilities: P{N(t) ³ 1} = 1 – (1 – p)t P{T > t} = (1 – 1/m )t
Estimators of parameters: F = N(t*)/t* M = 1/F = t*/N(t*)
Probability Model for Costs of Landslides
Random variables: X: Cost of landslide Y(t): Total costs
Probability distributions: Pareto Lognormal ![]()
Means or expected values: E[X] E[Y(t)] = E[N]E[X]
Standard deviations: S[X] S[Y(t)] = {E[N](S[X])2 + (E[X])2(S[N])2}1/2
Random variable: W: Aggregation of total costs
![]() Probability distribution: Normal
Probability distribution: Normal
Mean or expected value:
![]()
![]()
![]() Standard deviation:
Standard deviation:
![]()
| AccessibilityFOIAPrivacyPolicies and Notices | |
| |
|