Cruise Report; RV Moana Wave cruise M1-01-GM; the bathymetry and acoustic backscatter of the mid shelf to upper slope off Panama City, Florida, northeastern Gulf of Mexico; September 3, through October 12, 2001, Panama City, FL to Panama City, FL
Daily Log
September 3, 2001 (JD 246)
We departed Panama City 0800 hr local and headed for the northern
part of the survey area to commence the patch test. By 1400 hr
we were at the patch test area and began to survey of seafloor
targets that would provide a reference point for the testing.
Seafloor targets were hard to come by so after two hours of searching
we headed for an increase in slope at about 100 m water depth.
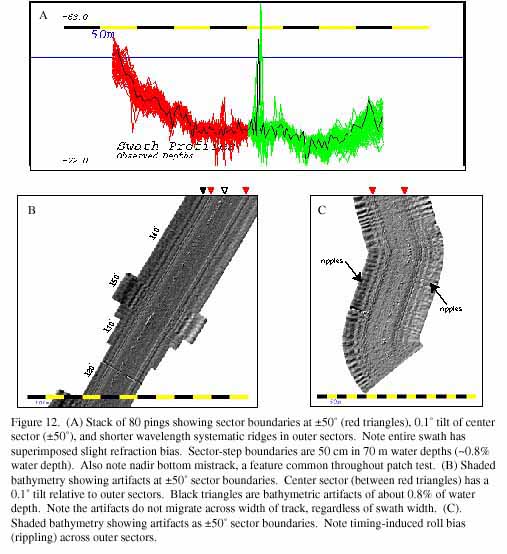
During the search, we noticed that the quality of both the bathymetry
(Figure 12, 60kb) and backscatter
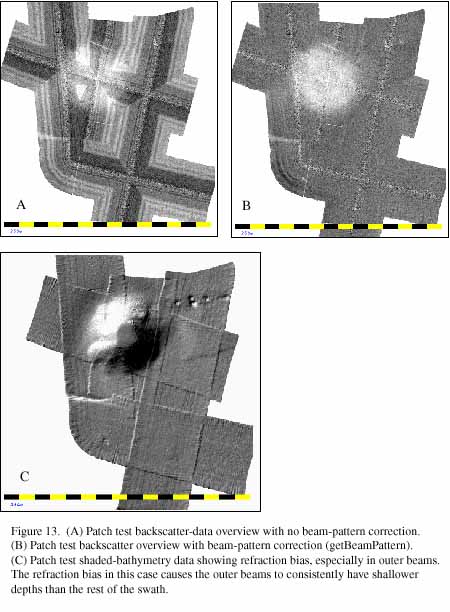
(Figure 13, 53kb) was poor (Figure12, 60kb, Figure13,
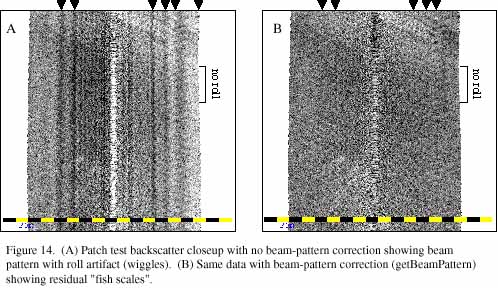
53kb, Figure14, 57kb, Figure15, 37kb). The backscatter showed pronounced sector boundaries and
beam-pattern striping along track. Although these can be cosmetically
corrected by processing, the underlying problems that create these
artifacts were troubling. However, the more vexing problems were
with the bathymetry. The sector boundaries generated 30 to 50-cm
artifacts that paralleled the track, In addition, the inner sector
appeared to be tilted about 0.1° relative to the two outer
sectors. An internal check of the transducer reported that 24
elements failed in 7 of the128 staves. Potentially, this was a
serious problem and the afternoon and evening were spent checking
out the electronics and formulating a message to Simrad/Norway
for assistance. The night was spent running a small survey outside
the area of interest, in a region of flat seafloor, to have an
area of data to analyze the various artifact.
September 4, 2001 (JD 247)
Simrad/Norway contacted the ship at 0900 L and suggested a
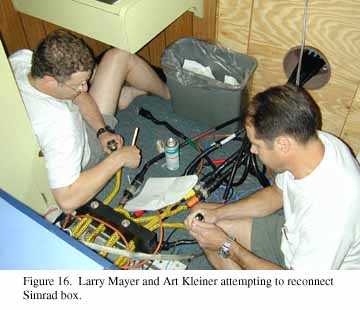
series of diagnostic tests for us to perform. The first test was
to disconnect and reconnect the 16 electrical cables that lead
directly form the transducer to the Simrad box (Figure
16, 32kb). This did not improve the data. The second test
was to swap the four Simrad transmit/receive boards into various
slot patterns (i.e. 1-2-3-4; 2-3-4-1; 2-4-1-3, etc) to see if
the artifacts remained or disappeared. Once the boards were switched,
the system was turned on and a short line was run for comparison
to the previous series of lines. The artifacts persisted throughout
these test. The third test was to measure the transmit voltages
at the back of each board. The voltages measured correctly. The
fourth test was to check each of the 128 stave leads for continuity.
They all checked out. This left us with the dilemma that the problem
resided in the transducer itself. A call to Simrad/Norway confirmed
our conclusion that the transducer was bad. All this testing took
until late in the afternoon. The last test of the MBES showed
that the total system failed and it could not acquire a bottom
lock.
September 5, 2001 (JD 248)
We arrived at the Panama City dock at 0600 L and John Hughes
Clarke and Mike Annis departed the ship at 0800. The day was spent
fixing various computers and improving various software programs.
September 6, 2001 (JD 249)
The day was spent at the dock in Panama City.
September 7, 2001 (JD 250)
The day was spent at the dock in Panama City. The transducer
arrived at New Orleans International Airport in the morning and
was cleared through US Customs by noon. C&C personnel picked
up the transducer and drove it to the ship, arriving at 2030 L.
The transducer could not be tested in air so nothing further could
be accomplished.
September 8, 2001 (JD 251)
The transducer was mounted on the bow ram and attached to
the bow in 1.5 hr. John Hughes Clarke was picked up at the airport
at 1400 L and we were underway for testing by 1545 L. We headed
for a location on the northwestern region of the area to be mapped,
hoping to find suitable targets for a complete patch test.
We arrived at the patch test area at 2100 L and commenced a
full patch test, starting with a CTD cast to get the sound-speed
profile (SVP). Patch testing continued through the night. A good
patch-test target was found that appears to be the impressions
in the seafloor of a jack-up rig (Figure17,
29kb). A timing and roll patch test found a 0.4 s timing shift
and a offset 0.8° roll bias. The timing offset was applied
at swathed and the roll bias was entered in the Hydromap acquisition
software.
September 9, 2001 (JD 252)
The patch test was completed and mapping began at 0830 L.
The mapping began at the northeast corner of the planned area
(Destin Pinnacles area), at the 50-m isobath, and progressed to
the southeast. Small problems with erratic beam pattern, poor
phase detection of the bottom, and a highly variable sound-speed
profile cropped up during the day.
Several small bathymetric features with relief of <2 m and
high backscatter were mapped in the northwest area. The features
are similar to the smaller patches of hardgrounds mapped in the
Pinnacles area. The weather was hot and humid and the seas were
calm.
September 10, 2001 (JD 253)
The weather was hot and humid and the seas were calm. Routine
data collection with excellent data quality, although a persistent
artifact began to appear. A series of beams, but not always the
same beams, would track between 20 and 50 cm below the average
seafloor on a random schedule. The artifact is about 0.5% of the
water depth so it falls at the limit of resolution of the system.
Also, a moving 500 beam-average technique was tested to remove
some of the beam pattern that cosmetically degrades the backscatter
image. The technique appeared to work so it was continued throughout
the day.
September 11, 2001 (JD 254)
Routine data collection. Today we were shocked by the news
of the attacks on New York and Washington DC. The reaction aboard
ship was one of total disbelief. We rigged up an antenna for a
portable radio to get continuous radio reports.
The wind freshened to 35kt late in the evening and continued
throughout the night. The wind and seas picked up to the point
that bubble wash-down over the bow and transducer rendered very
poor quality data. We altered the ship speed to reduce pitching
but to no avail.
The survey began to produce results almost immediately. An
extensive barrier reef complex was mapped with a summit at about
the 62-m isobath (Figure18, 33kb).
The seafloor on the north side of the reef is about 3 m shallower
than the seafloor on the south side. Also, what appears to be
an erosional moat occurs immediately to the south of the reef
front. The reef is composed of a series of at least 3 ridges;
the main reef front rising 4 m, and at least two low ridges rising
about 1 m that lay in front (to the south) of the main reef.
September 12, 2001 (JD 255)
The wind and seas persisted at 35 kts and 6 to 8 ft, respectively.
The data quality was poor so we altered the plan and headed for
the western edge and commenced running lines at the 125±-m
isobath but parallel to the survey headings (NW-SE). Because the
ship was rolling ±4° on the transit to the western
edge, a series of roll tests were run to check for roll bias.
The weather forecast showed a deep low-pressure disturbance about
200 m south of us and moving to the NNW. The heavy seas and wind
continued throughout the day and evening causing poor-quality
data on the SE lines and marginally acceptable data on the NW
lines.
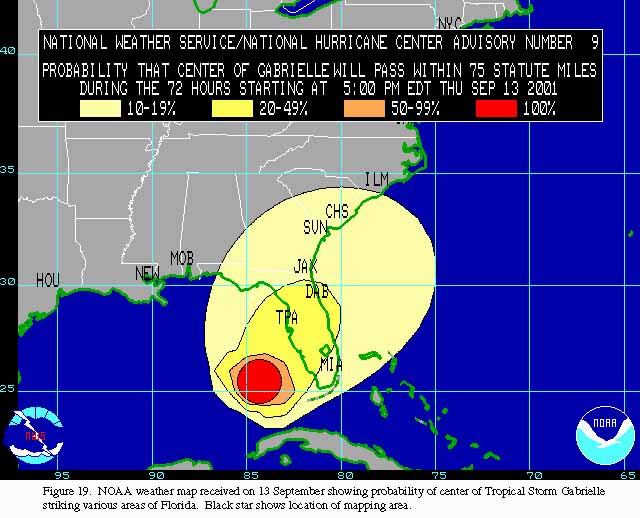
September 13, 2001 (JD 256)
The weather worsened during the night but the data on the
NNW course continued to be OK. We received weather reports from
C&C home office every 3 hours and watched as tropical disturbance
Gabrielle developed into a tropical storm. Although the seas and
wind abated during the day, the wind came around to the SW and
built up during the early evening. The predicted path of the storm
was about 180 km south of us (Figure
19, 67kb) so we decided to stay at sea and continue mapping.
The data continued to have random "pull downs" with
an amplitude of about 40 cm of several adjacent beams. The shallow
depth of the transducer resulted in severe bubble wash down during
the SW course. Even with the storm-degraded data, we were able
to map a large field of bedforms on a slope along the 100- to
112-m isobaths.
September 14, 2001 (JD 257)
The seas and wind continued throughout the day but the forecast
was for a moderation late in the day and evening as Gabrielle
moved across the Florida peninsula and out into the Atlantic Ocean.
The data were still of poor quality on the SE heading but acceptable
on the NW heading. We continued to define a series of sediment
covered reef-like features in the Destin Pinnacles area that are
concentrated between the 85- and 120-m isobaths with bedforms
on their west- and south-facing slopes. We switched to a 500-m
fixed swath with a 400-m line spacing when the water depths shoal
to about 100 m. Deeper than 100 m, we used a fixed 600-m swath
and 500-m line spacing.
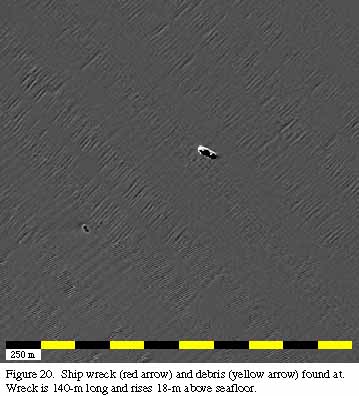
September 15, 2001 (JD 258)
The seas and wind laid down and ideal mapping conditions prevailed.
The day was spent routine mapping. A ship wreck (Figure
20, 21kb) was found at 29.91806°N 86.58228°W in 100
m water depth
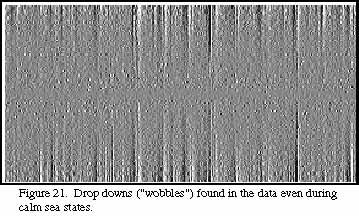
September 16, 2001 (JD 259)
The day was spent routine mapping with excellent data quality.
The data continued to be plagued by "wobbles" (Figure
21, 29kb) random drop downs of 40 to 60 cm, the cause of which
were unknown. The wobbles occur even when we have no roll or pitch.
September 17, 2001 (JD 260)
We broke off mapping at 0300 L and headed for Panama City
to exchange some of the scientific staff. We arrived at the dock
at 0730 L and we underway at 1130 L after loading groceries and
picking up spares.
We arrived back at the map area at 1700 L, took a CTD cast,
and were mapping by 1730L. Three lines were required to complete
the northern section of the survey area.
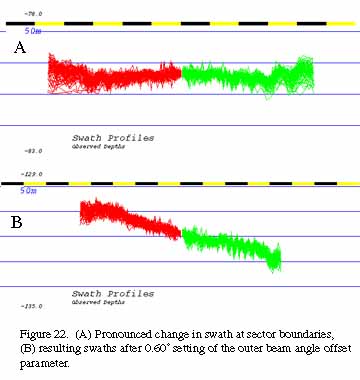
September 18, 2001 (JD 261)
The day was spent routine mapping with seas calm and slight
breezes. The data quality was excellent. The central section of
the survey area was begun and immediately located several areas
of interesting relief. We received an email from C&C/Lafayette
that it one of the artifacts, the outer sectors being deflected
up relative to the middle sector (Figure
22, 25kb), might be caused by not compensating for the change
in beam-forming characteristics versus water temperature at the
transducer. A Simrad software upgrade added a parameter "outer
beam angle offset" in the setup parameters. This parameter
was set at 0 during the initial setup and had not been changed.
We ran a small test by taking a sound-velocity profile with the
CTD, entered the new sound-velocity profile into the software
and ran two 10-minute lines; one with the outer beam angle offset
at 0.95° and the second at 0.60°. The 0.60° setting
produced acceptable results so we stayed with it
September 19, 2001 (JD 262)
Routine day of mapping with excellent data quality. The day
was hot with calm wind and a flat sea. Porpoise playing around
the bow caused numerous data dropouts throughout the day. Late
in the day the water depths varied between 85 and 130 m so the
system was switched to automatic mode to see if the system would
automatically change from shallow (0.2 ms) to medium (0.7 ms)
mode and back without operator intervention. The system stayed
in shallow mode.
September 20, 2001 (JD 263)
Routine day of mapping with excellent data quality. The day
was hot with calm wind and a flat sea.
September 21, 2001 (JD 264)
Routine day of mapping with excellent data quality. The day
was hot with calm wind and a flat sea. At 1800 L the data got
very noisy, probably caused by a school of porpoise playing off
the bow. The porpoise blocked out much of transducer for about
10 minutes until they moved away from the ship.
The Swathed software seemed not to be adding -3 dB during mosaicking
the acoustic backscatter when the pulse length changed from 0.2
to 0.7 ms. The shifts will have to be reprocessed back in the
lab.
September 22, 2001 (JD 265)
Routine day of mapping with excellent data quality. The day
was hot and humid with flat seas.
September 23, 2001 (JD 266)
Routine day of mapping with excellent data quality. The day
was hot and humid with flat seas. We discovered that the bottom-tracking
gate on the Simrad runtime parameters had been set at 40 to 180
m, causing the bottom signal to get very noisy in water depths
deeper than 180 m. The southern end of the central area is deeper
than 180 m and the data quality in this region is poor because
of this setting. We opened the tracking gate to 250 m and the
data quality immediately improved.
The NOAA measured tide data stopped coming to the ship via
email. The last day's measured tides were on Sept. 21. A comparison
was made between the measured and predicted tides for this day
and found to differ by only 11 cm at the maximum deviation. So,
we continued to use predicted tides while querying NOAA to continue
to send measured tide data.
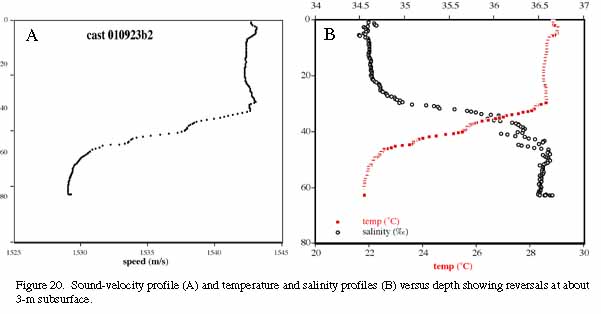
We completed the western extent of the central area at about
1300 L and ran an east-west cross line along the southern border
of the north area for calibration. A sound-velocity cast was run
just prior to extending the central area to the east and line
384 was began. However, after only 10 minutes of running the line
we noticed a pronounced refraction problem so we terminated the
line and took another sound-velocity cast. The second cast showed
a strange sound-velocity profile (Figure
23, 21kb), especially in the upper 50 m.
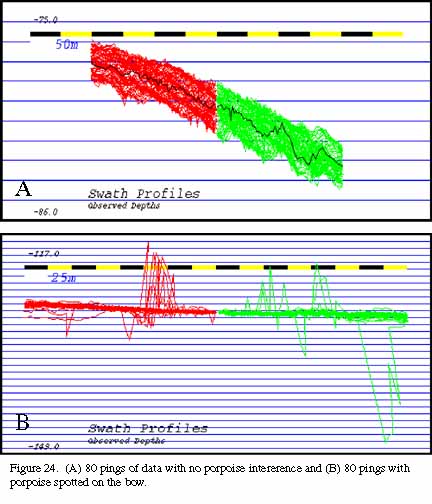
Porpoise continued to interfer with the transducer at random
intervals of about 5 minutes at a time, scattered throughout the
day. The effect is to cause data dropouts across the transducer
range (Figure 24, 46kb). Weather
closed in on us late in the afternoon with the wind picking up
to 20 kts, heavy overcast sky and squalls.
We completed the middle of the central section at about midnight
and ran a cross line (line 395) to begin filling in the shallower
eastern portion of the central section. Refraction became a persistent
problem in the shallow area. This required taking numerous CTD
casts throughout the lines to correct for changing water-column
conditions.
September 24, 2001 (JD 267)
Routine day of mapping with excellent data quality. The ship's
gyro crashed in the night and it required 1.5 hr to repair it.
The weather continued to be overcast, breezy, and rainy. The sea
developed a chop that induced a slight pitch to the ship and adversely
affected the data. The slight pitch, coupled with the fact that
the ship is riding several feet higher out of the water because
of having burned three weeks of fuel, has brought the transducer
even closer to the water surface and potential bubble wash. We
slowed the ship from 10.5 kts to 8.5 kts and the data significantly
improved. The depths began to shoal to 60 to 80 m so we reduced
the swath width from 450 to 250 m to reduce the effect from the
outer beams flapping.
The DGPS unit within the POS/MV started losing its lock on
satellites. The result was that the yaw accuracy started drifting
about 0.5% (~ 1.5 m). This was still well within our 4-m pixel
size but it alerted us a potential problem.
September 25, 2001 (JD 268)
Routine day of mapping. The weather was overcast but began
to clear in the afternoon. The wind calmed and the seas came down.
The data quality continued to look good but the persistent artifact
at the sector boundaries (about 30 cm) continued to show in the
shaded-relief images. The artifact is at or below Simrad's minimum
resolution so nothing much can be done about it at this stage.
The SGI processing computer crashed 5 times within 30 minutes
during the afternoon. Each crash powered down the CPU but the
disks still had power. All cables and UPSs were checked and found
fine. All disks had plenty of room and the system disk appeared
OK. We monitored the system disk usage and could see that the
system was taking 100% of the available RAM for short intervals.
However nothing relevant to the crashes was apparent in the system
log. The entire afternoon and evening was spent trying to determine
the cause of the crashes. It appeared to crash when more than
one process was running at the same time. Typically, RT, Cube,
makess, and weigh_grid were all running at the same time. This
had not been a problem during the cruise up to this afternoon.
When only one process was run, the system crashed only every 5
to 8 hrous. Although this slowed the processing, we went into
the single-process mode and continued processing data. Cube was
stopped on line 450.
September 26, 2001 (JD 269)
The day was partly cloudy, cool with lumpy seas, mostly coming
abeam of the ship causing rolls of about ±3°. The data
quality continued to look good. The SGI almost stayed alive all
night with only one crash. A mirror of the SGI directory structure
was constructed on the spare SGI (caspian) and realtime RT was
transferred to Caspian. Cube was not restarted on caspian because
of the limited disk space.
The Simrad data-acquisition software (Hydromap) crashed during
Line 470. Evidently the navigation input was corrupted and the
software could not read it. It took about 45 minutes to get the
software reloaded and accepted.
The sky cleared and the seas became calm in the evening.
September 27, 2001 (JD 270)
Routine day of mapping with excellent data quality. The day
was warm, breezy, and clear. We finished the central section at
2330 L and commenced the southern section. To this point, we were
on schedule.
September 28, 2001 (JD 271)
We completed one line along the shallow (east) side of the
southern section and continued southeast to the Steamboat Lumps
area. We began mapping the Steamboat Lumps area at 1000 L. The
day was overcast with a persistent 25 to 30 kt wind out of the
north that generated a 6-ft sea.
September 29, 2001 (JD 272)
The wind, swell, and seas worsened during the night and by
morning we had 10-ft swell, 10-ft seas and 35-kt winds. The seas
and swell were about 10° from one another giving the ship
a cork-screw ride. The ship's motion, rapid ±7° of
roll and ±5° of pitch, badly degraded the data. During
the morning, acoustic backscatter from the starboard outer sector
suddenly went black and the overall starboard signal strength
dropped to unacceptable levels, as if the one or more of the amplifiers
failed. The acoustic backscatter in the middle of Line 544 dropped
to 50 dB. At first the signal-strength drop appeared to be
isolated to the starboard outer sector, but a series of tests
changing the swath width revealed the problem to occur across
the entire starboard swath. The Simrad system was powered down
and restarted before the beginning of Line 546 to see if the system
would reset itself. The problem persisted so we ran a reciprocal
course to put the seas on our opposite side to see if the lack
of signal strength was related to the rough seas. The starboard
signal strength remained unacceptably low so the problem was not
sea related. The final test was to switch the transmit/receive
circuit boards in the Simrad unit. When board 1 and 4 were switched,
the low-signal strength switched from the starboard to port side.
This test confirmed that a Simrad transmit/receive board had failed.
There were no spare Simrad boards aboard ship so the C&C office
was contacted to send a new board to Panama City for us to pick
up. We terminated the mapping at 0900 L and steamed for Panama
City.
September 30, 2001 (JD 273)
We reached the dock at Panama City, FL at 0730 L. The C&C
office was unable to obtain fuel at the Port of Panama City because
it was the weekend. The concern for fuel was to ballast the ship
down because at the present fuel load the ship was riding at least
0.8 m higher that with a full load. The present draft of the transducer
is only 0.5 m, much too shallow for ideal data collection.
The replacement Simrad computer boards could not be shipped from
Seattle, evidently because of security concerns, so a Simrad employee
had to hand carry the boards from Seattle to Lafayette then a
C&C employee drove the 8 hours from Lafayette to Panama City.
The board was due in Lafayette at midnight, causing at least another
24-hr delay in the cruise.
October 1, 2001 (JD 274)
The circuit board arrived at 0800 L and the Simrad system
was checked out and was performing to specifications. We departed
the dock at 0845 L and steamed to the north border of the central
area while checking out the multibeam system performance. We arrived
at the start point at 1330 L, took a CTD cast, and commenced mapping
on Line 546.
October 2, 2001 (JD 275)
Routine day of mapping. The weather was clear, warm, and breezy
with light seas. The water-velocity structure at the Steamboat
Lumps MPA is very complicated with the eastern end having a different
vertical structure from the western end. This cause considerable
refraction problems that required a lot of effort with the empirical
refraction tool. Numerous CTD casts were made but the water structure
continuously changed.
During the afternoon the data quality started to be degraded
on west headings. We slowed to 8.5 kts and the data improved.
Consequently, we could map on east headings at 9.5 kts and westward
headings at 8.5 kts. This improved the data quality. The predicted
tides, however, proved unacceptable. The NOAA Tides Group suggested
we use the predicted tides from the Clearwater Beach, FL station
for the Steamboat Lumps survey. These tides produced tide artifacts
in excess of 1 m, especially in the eastern part of the Steamboat
Lumps area. Rather than change the tide model half way into a
map, we continued with the predicted Clearwater Beach tides and
generated new tides corrections for Steamboat Lumps from the measured
tides after the cruise.
October 3, 2001 (JD 276)
Routine day of mapping. The weather was partly cloudy, warm,
and breezy with light seas. The Steamboat Lumps survey took longer
than expected because the existing bathymetry is not too accurate.
The water depths of the top of the reef complex is at about 70
m requiring a 350-m swath width throughout almost the entire area.
Finally, in the early evening, the average water depths approached
90 m and we expanded the swath to 400 m.
October 4, 2001 (JD 277)
Routine day of mapping with excellent data quality. The weather
was partly cloudy and mild with a fresh wind out of the northwest,
creating a 2- to 3-ft chop. This did not affect the data quality.
The mapping of Steamboat Lumps Marine Protected Area was completed
at 1700 L and we ran a cross line north through the entire area
on our transit back to the South area. We collected 69,516,500
depth measurements and at least 5 times that number of acoustic
backscatter measurements in the Steamboat Lumps survey.
October 5, 2001 (JD 278)
We began mapping in the South area at 0300 L. The weather
was cloudy, humid, and calm. The seas were running a 2-ft swell.
We increased the line spacing to 350 m with a 400-m swath and
ran at 9 kts to the northwest and 9.5 kts to the southeast. The
data quality was excellent at these speeds.
The seas picked up to 3+ feet in the late afternoon and produced
±6° rolls that did degrade the data somewhat. The Simrad
computer unexpectedly crashed at 1930 L but was back up and running
in a few minutes, leaving only a small data gap. Simrad crashed
again at 2000 L.
October 6, 2001 (JD 279)
The seas stayed lumpy all day with 4- to 5-ft seas quartering
our course producing ±4° to 6° rolls and ±3°
of pitch. The data are degraded somewhat with a strong correlation
of ship roll with a pitch artifact. The wind came around in the
evening and the seas moderated a bit.
October 7, 2001 (JD 280)
The seas continued to be 3 to 5 ft in height all day, although
the data continued to be of good quality.
October 8, 2001 (JD 281)
The seas built to 6 to 9 ft during the night and continued
large during the day. The seas were coming out of the east which
put us in a quartering following sea on the northwest course and
the data were of good quality. However, on our southeast course,
we were quartering into the sea, rolling ±10° and pitching
±6°. In addition, the ship was running light because
of all the fuel consumed during this cruise. This motion brought
the transducer out of the water on the southeast course, causing
loss of signal and intense cavitation when the bow fell back into
the sea. The data quality on the southeast course is poor. Conditons
worsened during the evening and rolls of ±12 to 15°
with ±6° of pitch were common.
October 9, 2001 (JD 282)
The seas continued to be 6 to 10 ft throughout the day, producing
large rolls and pitches on the southeasterly courses. The data
quality from the southeasterly course are marginal because of
the numerous data dropouts. Data quality on the northwest course
are good.
October 10, 2001 (JD 283)
The seas began to subside by noon, although they still were
5 to 8 ft. The wind died down to 10 to 15 kts. The data quality
immediately began to improve.
October 11, 2001 (JD 284)
The South area was completed at the start of the day. We ran
a cross line across the bottom of the South area and commenced
running lines on the east (shallow) side of the South area. Once
one long line was run along the east side, the remainder of the
time was spent running shallow lines on the east side of the Madison-Swanson
MPA. The seas continued to be 6 to 8 ft and the wind came up to
35 kts, producing poor data-quality conditions on the southeast
courses but good-quality conditions on the northwest courses.
At 1730 L the POS/MV IMU crashed. The crash caused the loss
of vehicle motion sensing so the MBES system was shut down. The
the IMU was fixed at 2115 L and the line was resumed. The cruise
was terminated at 2300 L and we transited to Panama City, FL.
October 12, 2001 (JD 285)
We arrived at the dock in Panama City, FL at 0600 L, thus
completing the cruise.
Appendix I.
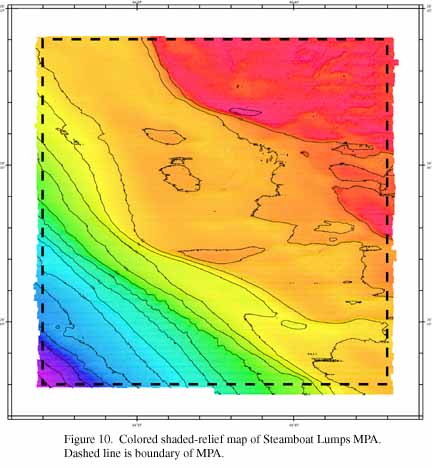
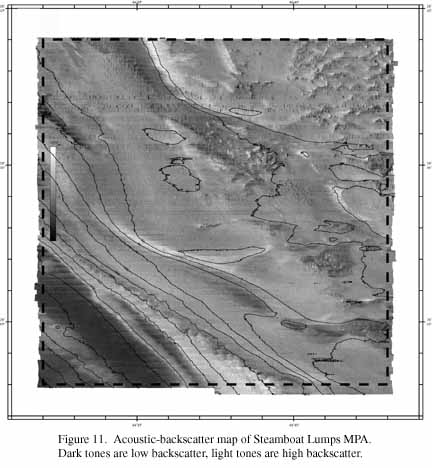
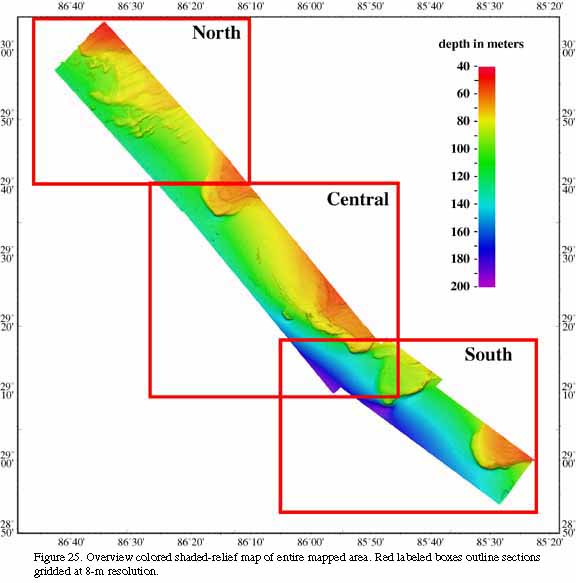
The maps on the following links, plus Figure
10, 39kb and Figure 11, 38kb,
are a summary of the mapping accomplished on this cruise. Because
the area is so large (i.e., the file sizes are huge), the area
was subdivided into North, Central, and South regions. The Overviews
are gridded at 16 m and the regions are gridded at 8 m.
- Figure 25, 38kb. Overview colored
shaded-relief map of entire mapped area. Red labeled boxes outline
sections gridded at 8-m resolution.
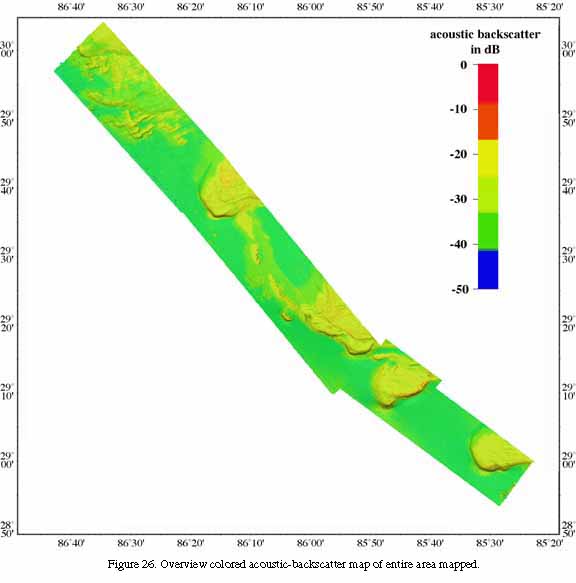
- Figure 26, 27kb. Overview colored
acoustic-backscatter map of entire area mapped.
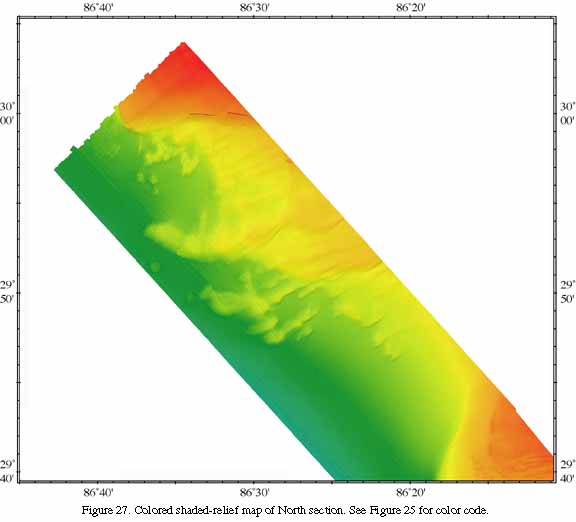
- Figure 27, 24kb. Colored shaded-relief
map of North section. See Figure 25 for color code. Note map is
rotated 90° counter clockwise.
- Figure 28, 26kb. Colored acoustic-backscatter
map of North region. See Figure 26 for color code. Note map is
rotated 90° counter clockwise.
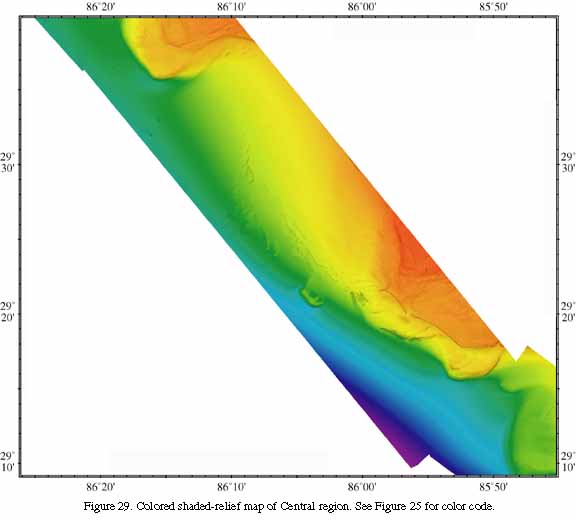
- Figure 29, 24kb. Colored shaded-relief
map of Central region. See Figure 25 for color code. Note map
is rotated 90° counter clockwise.
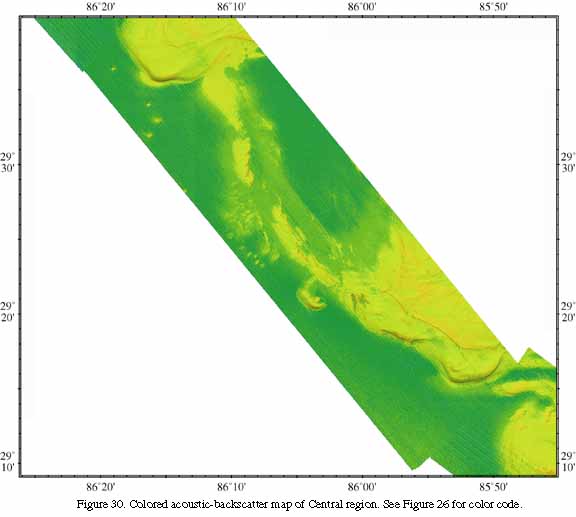
- Figure 30, 27kb. Colored acoustic-backscatter
map of Central region. See Figure 26 for color code. Note map
is rotated 90° counter clockwise.
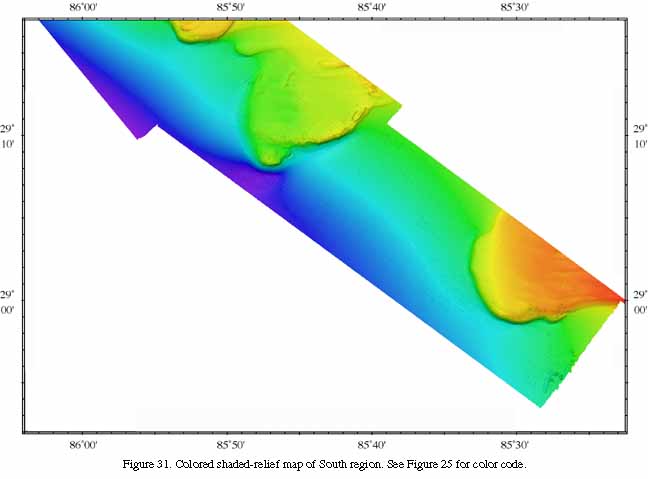
- Figure 31, 25kb. Colored shaded-relief
map of South region. See Figure 25 for color code. Note map is
rotated 90° counter clockwise.
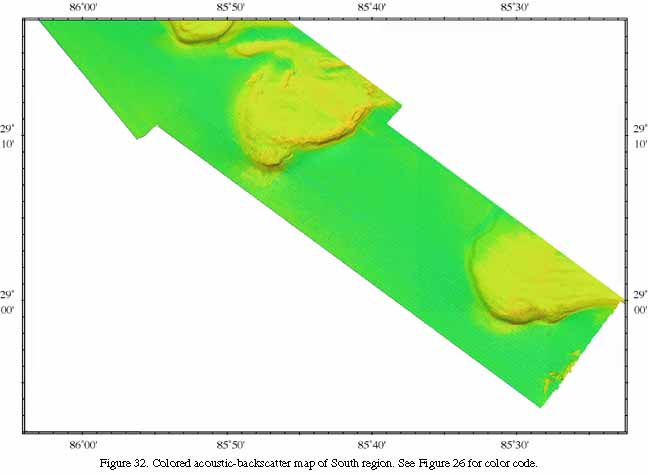
- Figure 32, 24kb. Colored acoustic-backscatter
map of South region. See Figure 26 for color code. Note map is
rotated 90° counter clockwise.
|

