Holocene Evolution, OFR 01-076
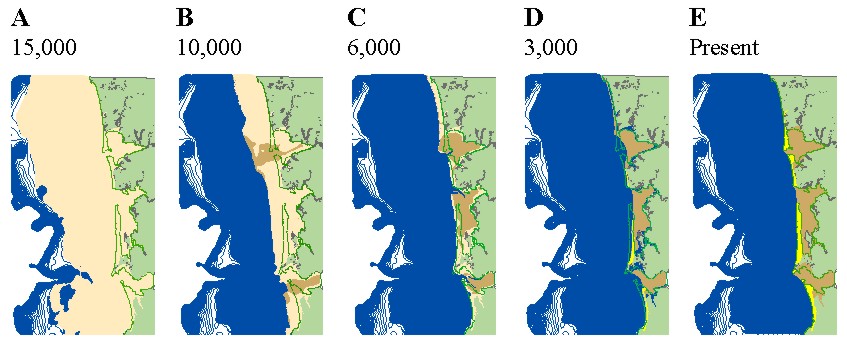
Home | Intro | Geology | Methods | Animation | Data | GIS | Acknowledgements | References | AppendixFigure 9. Maps showing the stages in the evolution of the coast within the Columbia River littoral cell from 15,000 yr BP to the present. Green represents land above present sea level, tan represents part of the shelf and bays that were subaerially exposed during lower sea levels, deep blue represents the ocean, brown represents bay and fluvial deposits, yellow represents the beaches, and the green line is the location of the present shoreline. 15,000 yr BP sea level was 150 m lower than present, and the shoreline was near the shelf edge except in the heads of Astoria and Guide Canyons and no sediment appears to have accumulated on the shelf or in the paleo-river valleys. 10,000 yr BP sea level was 47 m lower than present, the shoreline was much of the way across the study area, and by this time Grays Harbor was beginning to be flooded as well. 6,000 yr BP sea level was 11 m lower than present, all three bays had been flooded, and the shoreline (except in the North Beach sub-cell) has reached its maximum eastward extent. By 3,000 yr BP sea level was 3 m lower than present, and the barriers occupied the southern parts of the Clatsop and Long Beach sub-cells while barriers in the Grayland Plains and North Beach sub-cells did not start forming until 2,500 and 1,500 yr BP respectively. In fact, in the North Beach sub-cell, the shoreline was still seaward of its present location. The present shows all the barriers having formed and the partitioning between the three provinces.