| |  |  | | Lake Pontchartrain Atlas: | | | | | | | | | | | | | | | | | | | | | | Physical Environments |  | | | | | | | | | | | | | | | | | | | | | | |  | | | | | | | | | | |  | Physical Environments - Wave Climate Contributors: Peters, Beall, Buster Wave climate is one of the primary contributing factors controlling sediment, transport, deposition and erosion in the coastal environment. The wave climate is defined as the average wave condition over a period of years based on wave height, period, direction, and energy. Wind speed and direction and nearshore bathymetry are the primary forcing mechanisms of wave climate in coastal regions. The changing characteristics of barrier islands, inlets, and the nearshore are dependent on and respond to several variables, including the wave climate and the sediment supply of the area. Daily perturbations, short-term fluctuations, and long-term cycles of wind and wave activity (including the affects of frontal passages and hurricanes) will be reflected in the morphology of the coastline. Figure 61 shows the location of two moored buoys in the Gulf of Mexico and Figure 62 is a photograph of Buoy 42003 located in the central Gulf of Mexico. Figures 63 through 67 show examples of varying types of data used to forecast the wave and wind regime for the central Gulf of Mexico.  | 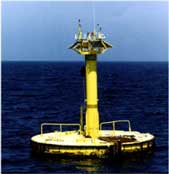 | | Figure 61: Location of two moored data buoys in the Gulf of Mexico. | Figure 62: NDBC's Buoy 42003 located in the central Gulf of Mexico. |  | | Figure 63: Average wave period of all waves during a 20-minute period. |  | | Figure 64: Dominant wave period is the period with the maximum wave energy. |  | | Figure 65: Significant wave height is calculated as the average of the highest one-third of all of the wave heights during the 20-minute sampling.. |  | | Figure 66: Peak wind speed of a 5 to 8 second duration gust is measured during a two- or eight-minute period. |  | | Figure 67: Wind speed is averaged over an eight-minute period for buoys. | Source: National Data Buoy Center web page (http://seaboard.ndbc.noaa.gov) « Previous | Next » |