
Contaminated Sediments Database for the Gulf of Maine, OFR 02-403
Home/Abstract
Site Map
Introduction
Content Overview
How to Reach Us
Database Construction
How to Access
the Data
Data Utilization
Data Tables & Maps
Geographic Context
& Outside Links
References Cited
Collaborators
Acknowledgements
DISCLAIMER
INORGANICS PLOTS AND GRAPHS
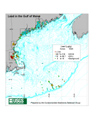
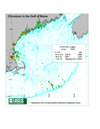
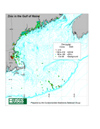
The following maps are surface samples of selected parameters in the Gulf of Maine Database. Click on the Lead image to view the Gulf of Maine and sub areas Boston Harbor, Great Bay, Casco Bay and Penobscot Bay. Cadmium, Chromium, Copper, Mercury, and Zinc include views of the entire Gulf of Maine and Boston Harbor. The Organic Carbon map shows samples from all depths, not just surface samples. The concentration ranges for the maps and histograms were chosen using sediment quality guidelines (SQG). For the maps, the numbers in parentheses in the legends represent the number of samples for that particular concentration range. The numbers on the smaller regional maps are representative of the whole Gulf of Maine. For the histograms, "n" refers to the number of samples for that particular parameter.
 |
 |
 |
 |
| Lead (151 KB) |
Chromium (145 KB) |
Copper (144 KB) |
Zinc (152 KB) |
 |
 |
 |
 |
| Lead (12KB) |
Chromium (12KB) |
Copper (12KB) |
Zinc (12KB) |
Download/view the Table of Inorganics Information
Filename: INOR2002.xls
(Microsoft Excel 5.0/95)
File Size: 4991 KB
Filename: INOR2002.txt
(Tab Delimited Text)
File Size: 4554 KB
HIGHLIGHTS OF METAL CONTAMINANT DISTRIBUTION
Concentrations of metal contaminants in Gulf of Maine surface sediments:
- Values range from natural background to three orders of magnitude above background.
- The highest contaminant values in surface sediments are located near urban areas, with a halo of elevated values around them.
- The patchy distribution of contaminant concentrations for bulk sediments throughout the Gulf of Maine reflects patchiness in both contaminant sources and sedimentary regimes.
Lead in Massachusetts Bays surface sediments:
Concentration values for lead (and Hg, Cu and many other contaminants) are above natural levels throughout most of Massachusetts and Cape Cod Bay. The urban area (greater Boston) is a source of contaminants to a large marine region through transport of water, sediment, and aerosols bearing contaminants. In Massachusetts and Cape Cod Bays, concentrations of metal contaminants (Ag & Hg) in surface sediments are at least ten times lower than typical Harbor values; however, the concentrations are still greater than naturally occurring background values throughout much of the Bays region. This indicates that contamination of marine sediments is widespread in the Bays and adds emphasis to the need for studies to assess the risk potential associated with exposure to elevated levels of contaminants in the environment.