Skip past header information
USGS Logo with link to USGS web page

Contaminated Sediments Database for Long Island Sound and the New York Bight, USGS Open-File Report 03-241


Texture Table

Introduction to the Texture Table

The Texture Table in the Long Island Sound and New York Bight Contaminated Sediment Database is a MS Excel 2000 document containing information on over 1900 samples. The Texture Table contains Unique Identification Numbers (Unique ID#) and source or reference for each sample as well as data pertaining to laboratory information and analysis fields (See Data Dictionary). The data are not reported in units common to all samples. However, they may be presented in more than one form, e.g.: as both phi class frequencies and cumulative frequencies.

The user should read all data entry, methodology, and comment columns in order to ascertain how the data were originally generated. Whenever possible grain size data were converted to percentage gravel, sand, silt, and clay. The various methods used to determine particle size return slightly different results. For example, the U.S. Army Corps of Engineers' sieve size measurements are not equivalent to phi size measurements used as standard measurements for other organizations.

The information in the Texture Table may be used in conjunction with location data from the Station Table to map the distribution of sample concentrations. A pie chart display and a selected map are shown below for illustrative purposes.

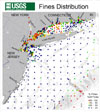
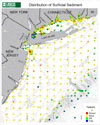
Texture Table Plots and Graphs

Sediment Distribution  
Fines Distribution
Distribution of Surficial Sediment

Fines Distribution

Distribution of Surficial Sediment


Download/view the Table of Texture Information
Filename: Texture.txt (Tab Delimited Text)
File Size: 661 KB


Skip Footer Information