|
|
|
|
|
|
|
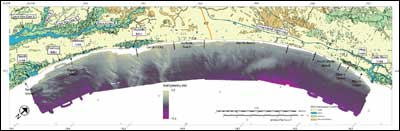
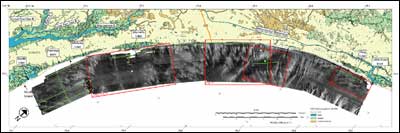
Bathymetry and Sidescan-SonarBathymetry (Figure 6) and sidescan-sonar imagery (Figure 7) identify a variety of seafloor features and environments within the study area, and provide insight concerning the processes controlling distribution of surficial sediment within Long Bay. A subsequent USGS report will provide detailed interpretation of these data when analyses and descriptions of groundtruth data are finalized. Here, general descriptions of bathymetry and sidescan-sonar data are provided, but the data are primarily used to illustrate benthic character associated with sub-surface features identified within the seismic reflection data. Figure locations, tracklines for seismic profiles and locations of groundtruth examples are superimposed upon the regional sidescan-sonar mosaic (Figure 7).
Bathymetric data (Figure 6) show the gentle seaward-dipping gradient typical of the inner continental shelf within Long Bay. Water depths range from 5 to 15 m with the deepest areas farthest offshore. Isolated bathymetric highs exist offshore of Waites Island, where a nearshore shoal complex abuts the shoreface, offshore of Myrtle Beach, where a large approximately NE - SW trending lobe extends seaward, offshore of Murrells Inlet, in the form of a large inlet-related shoal complex, and in the southern portion of the survey, where fields of shoreface-attached and shoreface-detached ridges trend offshore to the northeast. The inner continental shelf is generally low relief, but larger gradients do exist within the ridge fields, where crest to trough heights can exceed 5 m. The regional 100 kHz sidescan-sonar mosaic (Figure 7) is an acoustic image of the seafloor in which dark tones indicate areas of low acoustic backscatter and light tones depict areas of high acoustic backscatter. Preliminary analysis of groundtruth data (surficial sediment samples, vibracores and video data) indicate that low-backscatter returns represent less reflective substrates, where the seabed exhibits relatively low roughness (smooth or small rippled bedforms) and is composed of predominantly fine to medium-grained sands and muds. High-backscatter returns represent harder, more highly reflective substrates, where seabed roughness is greater (larger rippled bedforms, rubble surfaces and low relief ledges), and it is composed of coarse-grained sands, shell hash, gravel sized clastics and hardground. Large, relatively uniform low-backscatter regions (offshore Waites Island, Myrtle Beach and Murrells Inlet) generally coincide with positive bathymetric features, and are likely composed of fine- to medium-grained sand. In contrast, expansive areas of high-backscatter returns are generally found to be coincident with bathymetric lows, or areas of constant bathymetry, where coarse-grained sediment and outcropping hardgrounds are present at the seafloor.
|