Geologic Variables
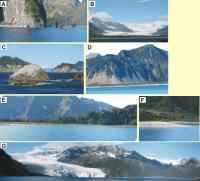
The geomorphology variable expresses the relative erodibility of different landform types (table 1). These data were derived using a database that was created to depict shore-zone classification determined from analysis of 1:12,000-scale black-and-white vertical aerial photographs (Mann, 1997) [http://www.nps.gov/akso/gis/]. In addition, field visits were made to accessible locations of the park to verify the accuracy of the classification (fig. 6A-G). Description in the book Living with the Coast of Alaska (Mason and others, 1997) were also used to help constrain the geomorphologic classification. Kenai Fjords NP contains several coastal landform types, including low to very low change-potential rock cliffs, moderate change-potential alluvial and glacial deposits, high change-potential gravel beaches and very high change-potential mudflats, sand beaches, and tidewater-glacier termini (fig. 6A-G, fig. 7).
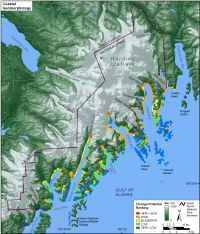
Shoreline erosion and accretion potential for Kenai Fjords was estimated from data contained in the shore-zone classification database and wave energy regime information (table 2) (Mann 1995, 1997;Crowell and Mann, 1995). Shoreline change-potential was estimated based on whether the shoreline was consolidated or unconsolidated and the amount of wave energy expended on the shore. Because the shoreline change-potential data was derived qualitatively from existing datasets, the categories for shoreline change-potential were limited to high, moderate, and low. Shoreline change-potential was not assigned to the very low or very high categories. Rock cliff areas were assigned low shoreline change-potential regardless of wave energy, because rock cliffs are not likely to experience significant erosion or accretion annually. Unconsolidated sediments within fjords were generally classified as moderate shoreline change-potential. Beaches along the exposed coast and areas where glaciers reached at or near the shoreline were classified as high change-potential. The shoreline change-potential within each 1-minute grid cell was averaged to determine the shoreline change-potential used here. Shoreline change-potential for Kenai Fjords NP ranges from low change-potential (areas not likely to experience significant shoreline change annually) to high change-potential (areas where shoreline change will likely occur within one year) (fig. 8).
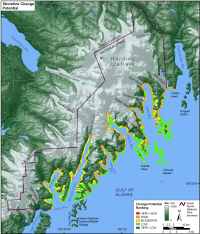
Regional coastal slope is an indication of the relative vulnerability to inundation and the potential rapid rate of shoreline retreat, because low-sloping coastal regions should retreat faster than steeper regions (Pilkey and Davis, 1987). The regional slope of the coastal zone was calculated from a grid of topographic and bathymetric elevations extending 10 km landward and seaward of the shoreline. Elevation data were obtained from the National Geophysical Data Center (NGDC) as gridded topographic and bathymetric elevations at 0.1-meter vertical resolution for 1-minute grid cells. Regional coastal slopes for Kenai Fjords NP fall within the very low to very high change-potential category (< 4.55% - > 14.7%) (fig. 9).