Results
In all, 136 tide stations were chosen to determine operational MHW, MHHW, and MTL elevations along the East, West, and Gulf Coasts. These include open coast stations as well as stations that are not fully on the open coast. It also includes 46 stations that were added to New England and New York whose MHW elevations were calculated by the "Mean Tide Level Method".
MHW, MHHW, and MTL: Raw Data
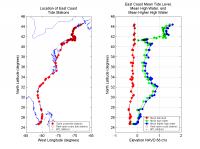 |
| Figure 2. East Coast tide station locations and their tidal datum elevations. Click on figure for larger image. |
Ninety-three stations were chosen along the East Coast. Of these, 47 had tidal datums referenced to a fixed vertical datum: 36 on the open coast and 11 not fully on the open coast. For 46 additional stations, the elevation of MHW with respect to NAVD 88 was calculated using the MTL Method. The locations of the 93 stations and the elevations of MHW, MHHW, and MTL for these sites are shown in Figure 2. Note that station locations in Figure 2 and all subsequent figures (except Figure 6 and Figure 22) are shown on the Defense Mapping Agency (now National Imagery and Mapping Agency) World Vector Shoreline (approximate scale of 1:250,000), which was obtained from http://rimmer.ngdc.noaa.gov/coast/getcoast.html. Although the NOAA Medium Resolution shoreline was used to identify open coast tide stations, it provided too much detail for the figures in this report. However, station locations in Figure 6 and Figure 22 are shown on the NOAA Medium Resolution Digital Vector Shoreline because part of Fire Island National Seashore (Long Island, New York) was missing from the World Vector Shoreline.
To better view the locations of the tide stations and their tidal datums, the East Coast was divided into seven sections and displayed with more detail in Figures 3-9. The stations have been numbered from north to south with number one being the most northern station and number 93 being the most southern. Station numbers have been plotted on Figures 3-9, and detailed information on each station can be found in Table 1 (PDF Format). MHW and MHHW vary considerably from north to south along the East Coast, while MTL remains fairly constant. MHW ranges from 1.48 m in Bar Harbor, Maine to -0.24 m NAVD 88 in Pigeon Key, Florida.
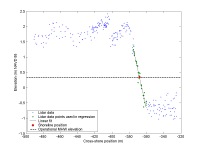 |
| Figure 1. Lidar beach profile from September 15, 1997 at Assateague Island, Virginia. Click for larger image. |
 |
| Figure 10. Gulf Coast tide station locations and their tidal datum elevations. |
Twenty-four stations were chosen along the Gulf Coast. Of these, eighteen are on the open coast and six are not fully on the open coast. Figure 10 shows the locations of the twenty-four stations and their MHW, MHHW, and MTL elevations. The Gulf Coast was divided into four sections, which can be seen in Figures 11-14. The stations have been numbered from West to East and information on each station can be found in Table 2 (PDF Format). Unlike on the East Coast, all three tidal datums on the Gulf Coast follow approximately the same trend. The elevations of MHW are much smaller on the Gulf Coast than on the East Coast, and the range of MHW along the coastline is smaller as well. The highest elevation of MHW occurs in Grand Isle, Louisiana (0.47 m) and the lowest elevation occurs in Captiva Island, Florida (0.02 m).
 |
| Figure 15. West Coast tide station locations and their tidal datum elevations.Click on figure for larger image. |
Nineteen stations along the West Coast were selected, eleven of which are located on the open coast, and eight of which are not fully on the open coast. The locations of these stations and their MHW, MHHW, and MTL levels are shown in Figure 15. The West Coast was divided into five smaller sections to show more detail (Figures 16-20). The stations have been numbered in order from North to South and detailed information on the stations is given in Table 3 (PDF Format). On the West Coast, MHW, MHHW, and MTL all follow approximately the same trend, decreasing from north to south. MHW is higher along the West Coast than along the East and Gulf Coasts, and the difference between MHHW and MHW is larger than on the East and Gulf Coasts, reflecting the stronger diurnal inequality on the West Coast. MHW ranges from 2.11 m in Mukkaw Bay, Washington to 1.28 m in La Jolla, California.
Tidal Datum Accuracy
Tidal datums at primary stations are calculated as the average of the values recorded over the 19-year NTDE (Marmer, 1951). To obtain an equivalent 19-year datum at secondary and tertiary stations, data at these stations are compared with simultaneous observations from an acceptable primary control station (Marmer, 1951). Using data from control tide stations, Swanson (1974) calculated generalized accuracies for tidal datums computed at secondary and tertiary stations along the East, West, and Gulf Coasts (NOAA, 2003). The confidence intervals for the tidal datums, which are based on the standard deviation error for the length of the record, are shown in Table 4 (PDF Format) (Swanson, 1974 and NOAA, 2003). While full error bars on the tidal datums presented in this paper are unknown because all sources and magnitudes of error are not known (e.g., error in tide gauge measurements, bench mark leveling error, etc.), it is evident from the data in Table 4 (PDF Format) that the error due to short record lengths is very small. Tidal datums on the Gulf Coast have the largest error bars due to short record lengths, yet even with only one month of observations, the datums are accurate to within +/- <6 cm.
The CO-OPS bench mark sheets list the "length of series", the time period over which the tidal datums were calculated, for each station. Of the 101 tide stations with record lengths listed, only 11 have just one month of data (this does not include stations with record lengths listed as the number of high and low waters used in the tidal datum computation). Fifty-one stations are either primary or secondary stations with 12 or more months of observations. The tidal datums from these stations have error bars that are less than +/- 3 cm on the Gulf Coast and less than +/- 2 cm on the East and West Coasts. The MHW elevations from the 101 stations whose record lengths are given, regardless of the length of the series used to compute the datums, as well as the MHW elevations from the 35 stations with no record length listed, are judged to be adequate for defining the elevation for shorelines derived from lidar data.
Operational MHW Elevations for Defining Lidar Shorelines
Twenty-seven MHW zones were created: twenty on the East Coast, three on the Gulf Coast, and four on the West Coast. Each zone has an operational MHW elevation which will be used to define all lidar shorelines within that zone. Appendix VI (PDF Format) shows both the lidar tiles and detailed zone boundaries for the East, Gulf, and West coasts.
East Coast
MHW elevations from the 93 tide stations chosen along the East Coast were used to establish the 20 MHW zones for this coast. The zones begin south of Reid State Park, Maine and end at Key Biscayne, Florida. Since lidar shorelines will not be extracted for the rocky coast of Maine or south of Key Biscayne, no zones were created for these areas.
MHW elevations for the East Coast zones range from 1.22 m in Zone 1 (southern Maine through Barnstable, Massachusetts) to 0.07 m in Zone 20 (Cape Canaveral through Key Biscayne, Florida). The variation in MHW elevations used to calculate the operational MHW elevation for each zone was less than 20 cm in all but one zone. Four tide stations were used to calculate MHW in Zone 2 (the outer coast of Cape Cod, Massachusetts), and the range of MHW for these four stations was 46 cm. Figures 21-25 show the locations of the East Coast zones, the tide stations located within each zone, and the MHW elevations used to calculate the operational MHW elevation for each zone. Table 5 (PDF Format) lists details for each of the 20 East Coast zones, including the lidar tiles found within each zone and descriptions of zone break points.
Gulf Coast
Three MHW zones were established for the Gulf Coast. No MHW zone was created for the region between Bald Point, Florida (on the Florida Panhandle), and Anclote Key, Florida (on the West Coast of Florida), because the coast in this region is primarily wetlands and no lidar shorelines will be derived in this area. Likewise, no lidar shorelines will be created along the Florida Everglades (south of Cape Romano, Florida).
Operational MHW elevations range from 0.09 m in Zone 21 (Anclote Key, Florida, to Cape Romano, Florida) to 0.37 m in Zone 23 (Texas through Sandy Point, Louisiana). Figures 26 and 27 show the Gulf Coast MHW zone boundaries, tide stations located within each zone, and MHW elevations used to calculate the operational MHW elevation for each zone. Table 6 (PDF Format) lists details for each of the Gulf Coast zones, including the lidar tiles found within each zone.
West Coast
 |
| Figure 28. MHW Zones 24 - 27. Left panel shows the northern and southern extents of the four zones, as well as the locations of the tide stations within each zone. Click on figure for larger image. |
Four MHW zones were created for the West Coast. Operational MHW elevations range from 1.33 m in the most southern zone to 2.10 m in the most northern zone. Figure 28 shows the locations of the West Coast zones, the tide stations located within each zone, and the MHW elevations used to calculate the operational MHW elevation for each zone. Table 7 (PDF Format) lists details for each of the four West Coast zones, including the lidar tiles found within each zone.
|

