Discussion
The data within the coastal vulnerability index (CVI) show variability at different spatial scales (Figure 13). However, the ranked values for the physical process variables vary less over the extent of the shoreline. The value of the relative sea-level rise variable is constant at very low vulnerability for the entire study area. The significant wave height vulnerability is low to high vulnerability. The tidal range is high to very high vulnerability for National Park of American Samoa.
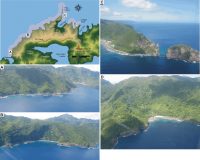 |
| Figure 4. Photographs of geomorphologic features on Tutuila in the National Park of American Samoa.Click on figure for larger image. |
| 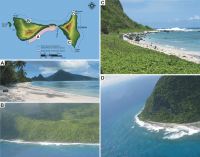 |
| Figure 5. Photographs of geomorphologic features on Ofu and Olosega in National Park of American Samoa.Click on figure for larger image. |
| 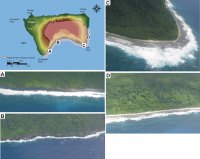 |
| Figure 6. Photographs of geomorphologic features on Ta'u in National Park of American Samoa.Click on figure for larger image. |
|
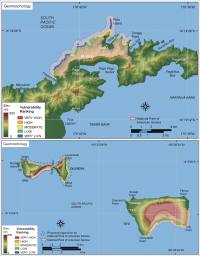 |
| Figure 7. Vulnerability ranking for coastal geomorphology within the National Park of American Samoa. Click on figure for larger image. |
| 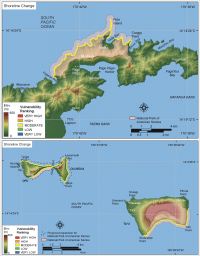 |
| Figure 8. Vulnerability ranking for shoreline change rates for the National Park of American Samoa. Click on figure for larger image. |
| 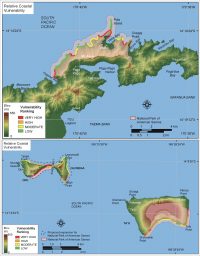 |
| Figure 13. Relative Coastal Vulnerability ranking for National Park of American Samoa. Click on figure for larger image. |
|
The geologic variables show the most spatial variability and thus have the most influence on CVI variability (Figure 13). Geomorphology in the park includes very high vulnerability sandy beach shoreline with fringing reef, high vulnerability rubble to cobble shoreline with fringing reef, moderate vulnerability alluvium or rocky coast with fringing reef, and low to very low vulnerability rock cliffs (Figure 4, Figure 5, Figure 6, and Figure 7). Vulnerability assessment based on shoreline change rate is constant at moderate vulnerability. Regional coastal slope is classified as low to high vulnerability (Figure 8).
The most influential variables in the CVI are geomorphology, regional coastal slope, significant wave height, and tidal range to a lesser extent; therefore they may be considered the dominant factors controlling how American Samoa will evolve as sea level rises.
Back to Top

 [an error occurred while processing this directive]