Skip past header information
USGS Logo with link to USGS Web page

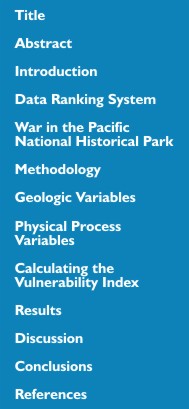
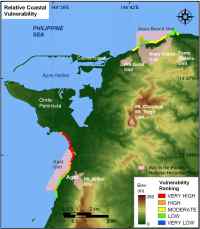
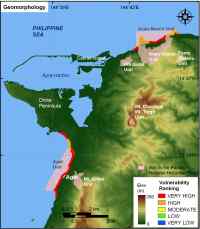
Coastal Vulnerability Assessment of War in the Pacific National Historical Park to Sea-Level Rise
USGS Open-File Report 2005-1056

Map of Coastal Vulnerability

Skip past contents informationTable of Contents link to Title Page Link to Abstract Page Link to Introduction Page Link to Data Ranking Page Link to GATE Link to Methology Page Link to Geologic Variables Page Link to Physical Process Variables Page Link to Calculating the Vulnerability Index Page Link to Results Page Link to Discussion Page Link to Conclusions Page Link to References Page

Discussion

Figure 11. Relative Coastal Vulnerability for War in the Pacific NHP.
Figure 11. Relative Coastal Vulnerability for War in the Pacific NHP. Click on figure for larger image.

The data within the coastal vulnerability index (CVI) show variability at different spatial scales (Figure 11). However, the ranked values for the physical process variables vary less over the extent of the shoreline. The value of the relative sea-level rise variable is constant at very low vulnerability for the entire study area. The significant wave height vulnerability is low to moderate. The tidal range is very high vulnerability (< 1.0 m) for all of the War in the Pacific NHP shoreline.

Figure 5. Coastal geomorphology for War in the Pacific NHP.
Figure 5. Coastal geomorphology for War in the Pacific NHP. Click on figure for larger image.
The geologic variables show the most spatial variability and thus have the most influence on CVI variability (Figure 11). Geomorphology in the park includes very high vulnerability sandy beach shoreline with fringing reef, and high vulnerability rubble to rocky shoreline with fringing reef (Figure 5). Vulnerability assessment based on shoreline change rate is constant at moderate vulnerability. Regional coastal slope is classified as very low to very high vulnerability (Figure 7).

Figure 7. Regional coastal slope for War in the Pacific NHP.
Figure 7. Regional coastal slope for War in the Pacific NHP. Click on figure for larger image.
The most influential variables in the CVI are geomorphology, regional coastal slope, and wave energy; therefore they may be considered the dominant factors controlling how Guam will evolve as sea level rises.

Back to Top


Skip Footer Information