Physical Process Variables
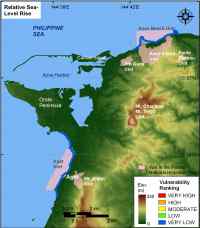 |
| Figure 8. Rate of relative sea-level rise for War in the Pacific NHP. Click on figure for larger image. |
The relative sea-level change variable is derived from the change in annual mean water elevation over time as measured at tide gauge stations along the coast. The rate of sea-level rise for Guam is 0.10 +/- 0.90 mm/yr based on 52 years of data (Zervas, 2001). This variable inherently includes both eustatic sea-level rise as well as regional sea-level rise due to isostatic and tectonic adjustments of the land surface. Relative sea-level change data are a historical record, and thus portray only the recent sea-level trend (< 150 years). Relative sea-level rise for War in the Pacific National Historical Park falls within the very low vulnerability category based on water elevation data in Guam (Figure 8).
Mean significant wave height is used here as a proxy for wave energy which drives the coastal sediment budget. Wave energy is directly related to the square of wave height;
E = 1/8 ρgH2
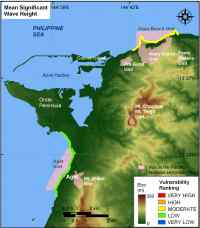 |
| Figure 9 Mean significant wave heights for War in the Pacific NHP based on NDBC data. Click on figure for larger image. |
where E is energy density, H is wave height, ρ is water density and
g is acceleration due to gravity. Thus, the ability to mobilize and transport coastal sediments is a function of wave height squared. In this report, we use historical mean significant wave height data for the period 1990-1993 obtained from the National Data Buoy Center (http://www.ndbc.noaa.gov/). Buoy station 52009 is located at 13.2 N 144.5 W with mean significant wave heights at 2.1 m. The Asan Beach Unit is ranked as moderate vulnerability with respect to wave heights; however, mean significant wave height is ranked as low vulnerability within the Agat Unit because this section of coast is partially sheltered from the dominant wave approach by the Orote Peninsula (Figure 9).
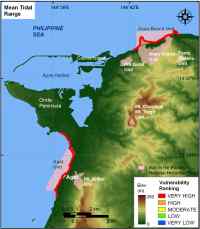 |
| Figure 10. Mean Tidal Range for War in the Pacific NHP. Click on figure for larger image. |
Tidal range is linked to both permanent and episodic inundation hazards. Tide range data were obtained from a NOAA/NOS published benchmark in Apra Harbor, Guam. Mean tidal range was 0.495 m, therefore War in the Pacific NHP is classified as very high vulnerability (< 1 m) with respect to tidal range (Figure 10).
.