Physical Process Variables
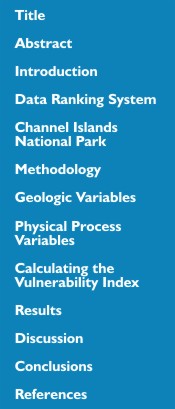
The relative sea-level change variable is derived from the change in annual mean water elevation over time as measured at tide gauge stations along the coast. The rate of sea-level rise for Santa Barbara, CA (closest to the northern Channel Islands) is 3.22 +/- 0.99 mm/yr based on 27 years of data, and the rate of rise for Newport Beach, CA (closest to Santa Barbara Island) is 2.22 +/- 0.53 (Zervas, 2001). This variable inherently includes both eustatic sea-level rise as well as regional sea-level rise due to isostatic and tectonic adjustments of the land surface. Relative sea-level change data are a historical record, and thus portray only the recent sea-level trend (< 150 years). Relative sea-level rise for Channel Islands falls within the low vulnerability category for Santa Barbara Island and moderate vulnerability for the northern Channel Islands based on water elevation data at Newport Beach and Santa Barbara, respectively (Figure 11). There were no sea-level rise data available for locations within the Channel Islands; therefore mainland approximations were used. Sea-level rise rates for the Channel Islands may be different than the values from Santa Barbara and Newport Beach; however these values are expected to be a close approximation of sea-level rise rate within the Channel Islands. For information on tectonics and land surface adjustments within the Channel Islands readers are directed to Sorlien (1994).
 |
| Figure 11. Rate of relative sea-level rise for Channel Islands National Park. |
|  |
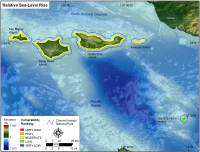
| Figure 12. Mean significant wave heights for Channel Islands National Park. |
|
Mean significant wave height is used here as a proxy for wave energy which drives the coastal sediment budget. Wave energy is directly related to the square of wave height;
E = 1/8 ρgH2
where E is energy density, H is wave height, ρ is water density and
g is acceleration due to gravity. Thus, the ability to mobilize and transport coastal sediments is a function of wave height squared. In this report, we use hindcast nearshore mean significant wave height data for the period 1976-95 obtained from the U.S. Army Corps of Engineers Wave Information Study (WIS) (see references in Hubertz and others, 1996). The model wave heights were compared to historical measured wave height data obtained from the NOAA National Data Buoy Center to ensure that model values were representative of the study area. Mean wave heights for the Channel Islands vary between 2 meters (moderate vulnerability) at San Miguel and western Santa Rosa to just less than 1 meter (very low vulnerability) at Anacapa (Figure 12).
 |
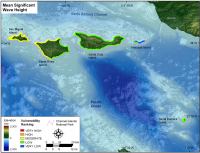
| Figure 13. Mean Tidal Range for Channel Islands National Park. |
Tidal range is linked to both permanent and episodic inundation hazards. Tide range data were obtained from NOAA/NOS published benchmarks from Bechers Bay on Santa Rosa Island. Mean tidal range was 1.05 m, therefore the Channel Islands were classified as high vulnerability (1.0 - 2.0 meters) with respect to tidal range (Figure 13).
.