Physical Process Variables
 |
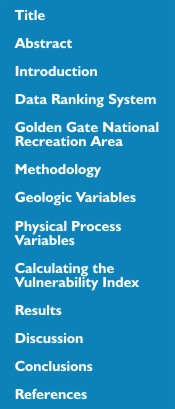
| Figure 8. Rate of relative sea-level rise for GGNRA. Click on figure for larger image. |
The relative sea-level change variable is derived from the change in annual mean water elevation over time as measured at tide gauge stations along the coast. The rate of sea-level rise for San Francisco (post- 1906 earthquake), CA is 2.13 +/- 0.14 mm/yr based on 94 years of data, and the value for Point Reyes is 2.51 +/- 1.27 mm/yr based on 25 years of data and (Zervas, 2001). This variable inherently includes both eustatic sea-level rise as well as regional sea-level rise due to isostatic and tectonic adjustments of the land surface. Relative sea-level change data are a historical record, and thus portray only the recent sea-level trend (< 150 years). Relative sea-level rise for GGNRA falls within the moderate to low vulnerability categories based on water elevation data at San Francisco and Point Reyes (Figure 8).
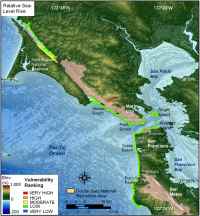
Mean significant wave height is used here as a proxy for wave energy which drives coastal sediment transport. Wave energy is directly related to the square of wave height:
E = 1/8 ρgH2
 |
| Figure 9. Mean Significant Wave Height for GGNRA. Click on figure for larger image. |
where E is energy density, H is wave height, ρ is water density and
g is acceleration due to gravity. Thus, the ability to mobilize and transport coastal sediments is a function of wave height squared. In this report, we use hindcast nearshore mean significant wave height data for the period 1956-75 obtained from the U.S. Army Corps of Engineers Wave Information Study (WIS) (See references in Hubertz and others, 1996). The model wave heights were compared to historical measured wave height data obtained from the NOAA
 |
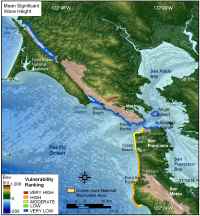
| Figure 10. Mean Tidal Range for GGNRA. Click on figure for larger image. |
National Data Buoy Center to ensure that model values were representative of the study area. For GGNRA , mean significant wave heights are between 0.1 and 2.5 m, which represents very low to high vulnerability (Figure 9).
Tidal range is linked to both permanent and episodic inundation hazards. Tide range data were obtained from NOAA/NOS published benchmarks from Ocean Beach, Tomales Bay, Bolinas Lagoon, Point Bonita, Alcatraz Island, and Half Moon Bay. Mean tidal range is between 1.1 and 1.3 m; therefore GGNRA was classified as high vulnerability (1.0 - 2.0 meters) with respect to tidal range (Figure 10).
.