Discussion
 |
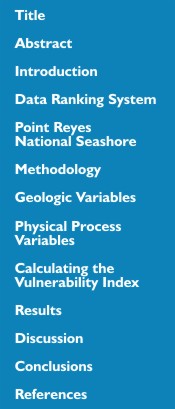
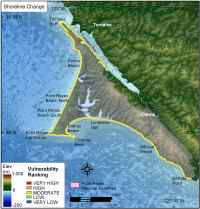
| Figure 11. Relative Coastal Vulnerability for Point Reyes National Seashore. Click on figure for larger image. | |
 |
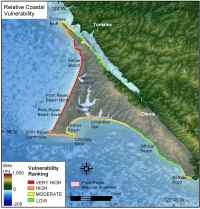
| Figure 4. Geomorphologic environments of Point Reyes National Seashore Click on figure for larger image. |
|
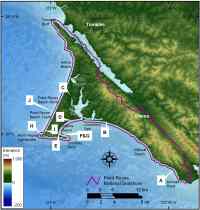
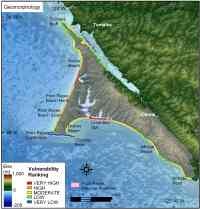
The data within the coastal vulnerability index (CVI) show variability at different spatial scales (Figure 11). The ranked values for the physical process variables vary less than the geologic variables. The relative sea-level rise variable is constant at moderate vulnerability, and the tidal range variable is constant at high vulnerability. The significant wave height vulnerability is very low to very high because Point Reyes National Seashore contains both wave-sheltered and wave-exposed stretches of shoreline. The geologic variables show the most variability and thus have the most influence on the CVI (Figure 11). Geomorphologic features in the park include very high vulnerability sandy beaches, high vulnerability gravel and cobble beaches, moderate vulnerability alluvium and coastal bluffs, and low to very low vulnerability rocks and cliffs (Figure 4 A-J and Figure 5). Vulnerability assessment based on shoreline change is constant at moderate vulnerability (Figure 6), but regional coastal slope is in the low to very high vulnerability range.
The most influential variables in the CVI are geomorphology, coastal slope, and mean significant wave height; therefore they may be considered the dominant factors controlling how Point Reyes will evolve as sea level rises.
 | | Figure 5. Coastal Geomorphology for Point Reyes National Seashore. Click on figure for larger image. | |
 |
| Figure 6. Shoreline change rates for Point Reyes National Seashore. Click on figure for larger image. | |