
|
|
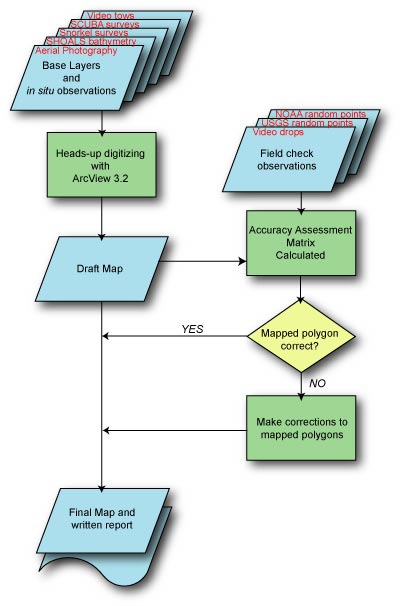
| U.S. Geological Survey Open File Report 2005-1070 Version 1.0 Moloka'i Benthic Habitat MappingMethodsThe USGS Moloka'i Benthic Habitat Classification Map was created from visual interpretation of aerial photography and SHOALS (Scanning Hydrographic Operational Airborne Lidar Survey) bathymetric data. In addition to the remotely sensed imagery, we utilized in situ knowledge from field data collected over a period of four years (1999 - 2003). These field data were collected using towed instruments, SCUBA, snorkel, and on foot, and include underwater photographs, video, and visual observations recorded in waterproof notebooks. Mapping was accomplished using a Geographic Information System (GIS) and a statistical analysis of accuracy was performed. The flowchart in Figure 2 illustrates the complete methodology.
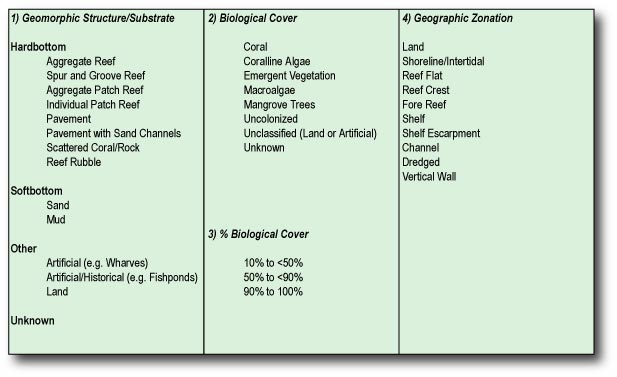
Figure 2. Flowchart illustrating methodology used to create habitat map. See text for complete description. Background Data - Base LayersAerial photography and SHOALS bathymetry data were used as the base layers for the visual interpretation of south Moloka'i reef benthic habitats. Aerial photographs at a scale of 1:35K, from Hale O Lono on the southwest end of the island to Puko'o in the southeast, were collected in 1993 by NOAA. These images were post-processed and mosaicked by the USGS, resulting in orthorectified digital images with a 1 meter per pixel resolution. Aerial photography at a scale of 1:24K collected by NOAA in 2000 was used for the extreme eastern portion of the south Moloka'i reef from Puko'o to Kumimi. These images were post-processed and mosaicked by a NOAA contractor, resulting in an additional orthorectified digital image with a 1 meter per pixel resolution. For further details on NOAA aerial photography for Moloka'i see http://biogeo.nos.noaa.gov/. Two SHOALS bathymetry datasets were collected in 1999 and 2000 along the south shore of Moloka'i by the U.S. Army Corps of Engineers (USACE), and post-processed and mosaicked by the USGS. Each of these datasets has a 4 meter per pixel resolution, however, the slight offset and overlap of the two datasets results in an overall image resolution of 2 meters per pixel. For further details regarding SHOALS data see http://shoals.sam.usace.army.mil. The maximum depth one can determine underwater features in the SHOALS bathymetric data is 35 m (120 ft), as compared to only 10-15 m (30-45 ft) in the aerial photography. Background Data - Other Data UsedSeveral other data sources were helpful in the visual interpretation of the digital base layers. In situ knowledge of the south Moloka'i reef was gained over a period of four years (1999 - 2003), by walking and snorkeling the shallow reef flat areas, and using SCUBA and towed instruments in the deeper offshore areas of the reef. This knowledge comes from a collection of underwater photographs, underwater video, and visual observations. Reef Flat TransectsMore than 40 shore-normal survey transects were completed by walking and snorkeling the shallow south Moloka'i reef flat. Approximately every ten meters along a transect line, the benthic habitat was documented in a waterproof notebook, occasionally a photograph was taken, and the latitude and longitude coordinates were marked using a hand-held GPS. Additional data collected during these reef flat transects include sediment thickness and sediment samples to be used in other USGS studies on the effects of sedimentation on the reef. SCUBA SurveysUnderwater video footage was collected on the fore reef along 15 shore-normal transects using a hand-held digital video camera in an underwater housing by divers on SCUBA. The latitude and longitude coordinates were collected with a hand-held GPS at the beginning of each transect. Divers collected video while traveling along a pre-determined direction, and additional coordinates were taken at the end of the transect. Deep-Water Video TowsIn water deeper than -27 m (-90 ft), underwater video footage was collected by towing a video camera along 30 transects, both shore-normal and shore-parallel. The camera system was connected to an onboard data logger and GPS receiver, which recorded the precise coordinates of the boat on the digital video. Other ObservationsOther data include georeferenced observations of bottom type and coverage as seen from the surface with a mask or viewbox. A total of 22 of these "head-in-the-water" observations were collected every few kilometers along the 10 m (33 ft) bathymetric contour from Hale O Lono to Kamalo. In addition, numerous hours of hand-held underwater video and still photographs were collected by scientists on SCUBA and snorkel throughout the course of the study. Although these data are not georeferenced to a specific latitude and longitude, the approximate location of the dives was known, and thus they provide a general idea of the bottom coverage types in those areas. GIS Beginnings and Heads-up DigitizingThe benthic habitat maps were created using ESRI's ArcViewGIS v.3.2 software with a Habitat Digitizing extension created by NOAA (to download the extension see http://biogeo.nos.noaa.gov/products/hawaii_cd/htm/digitize.htm). The Habitat Digitizing extension allows users to delineate habitat areas using "heads-up digitizing" and assigns attributes to the habitat polygons based on a pre-determined classification scheme using a point-and-click menu system. The classification scheme used was based on a scheme established by NOAA's biogeography program in 2002, and subsequently revised in 2004 (NOAA National Centers for Coastal Ocean Science, 2005). Developed with input from coral reef scientists, managers, local experts, and others, the hierarchal scheme allows users to expand or collapse the level of thematic detail as necessary. It was decided to use NOAA's scheme as a starting point to provide some continuity to the coral reef scientific community. However, modifications were made to the original scheme in order to better reflect the benthic habitats, geologic substrates and historical features (such as fishponds) found on Moloka'i. The modified classification scheme uses four basic attributes to describe each polygon on the benthic habitat map: 1) the dominant geomorphologic structure or underlying substrate; 2) the major biological cover found on the substrate; 3) percentage of major biological cover and, 4) the geographic zone indicating the location of the habitat (Figure 3). Note that 0% to <10% is not considered a category of percentage for any biological cover, as it is the equivalent of 90% to 100% Uncolonized. Each combination of a geomorphologic structure with an overlying biologic cover may be described as a separate habitat. A zone describes the cross-shelf location of a habitat and is common to current coral reef literature (Figure 4).
Figure 3. List of structure/substrate, biological cover, % biological cover and geographic zones used in the classification scheme (modified from NOAA National Centers for Coastal Ocean Science, 2005).
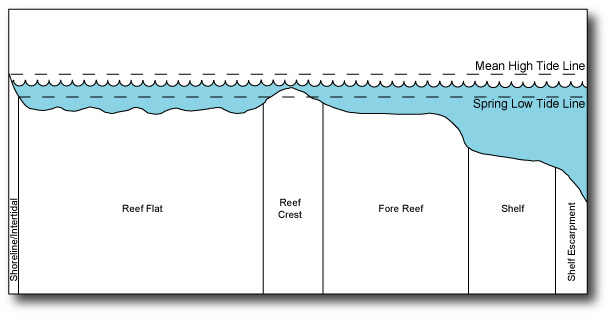
Figure 4. Schematic diagram showing the generalized cross-shelf coral reef zonation of Moloka'i. Not shown are Land, Channel, Dredged, or Vertical Wall (modified from Kendall et al., 2004). More than 4200 polygons, covering over 120 km2, were digitized by interpreting features seen in both the aerial photographs and SHOALS bathymetry layers, with additional input from other known data. A minimum mapping unit (MMU) of 100 m2 was used, however smaller features were mapped if they carried habitat significance (e.g., an individual coral colony 2 m in diameter located in an otherwise uncolonized area). Accuracy AssessmentThe validity, or usefulness, of any classification or interpretation may be determined with an accuracy assessment, which compares the interpretation with what is actually found in the field. In this project, the map's overall accuracy and accuracy from both the User and Producer points of view were determined. Overall accuracy indicates which points on the map are classified correctly according with a field check (Lillesand and Keifer, 1994). Producer accuracy indicates how well the map producer classified the different cover types (i.e., the number of points on the map labeled correctly). User accuracy indicates the probability that a point in a given class is actually represented by that class in the field (i.e., which mapped areas are actually what they say they are). A combination of field check data was used to measure the accuracy of the benthic habitat maps. Along the forereef, over 500 observations were made by lowering a video camera system vertically in order to collect images of the bottom type. In the nearshore waters of the reef flat nearly 50 randomly generated sample points were checked. In addition, observations made on the reef flat at over 200 randomly generated sample points, plus nearly 100 sampling points, from the NOAA database (http://biogeo.nos.noaa.gov/) were used in the accuracy assessment.
Once the accuracy assessment calculations were completed, misinterpreted polygons were corrected, thus increasing the percent accuracy of the final map. Next section: Results |
URL of this page: http://pubs.usgs.gov/of/2005/1070/
Date created: 18 February 2005
Created by: Susan A. Cochran
Maintained by: Susan A. Cochran
Date last modified: 5 July 2007 (sac)
USGS Privacy Statement | Disclaimer | Feedback | Accessibility
Department of the Interior | US Geological Survey | Biology | Geology | Mapping | Water