USGS Open-File Report 2005-1231
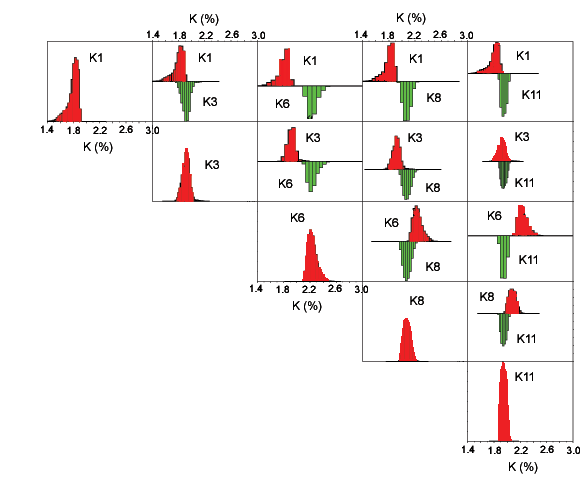
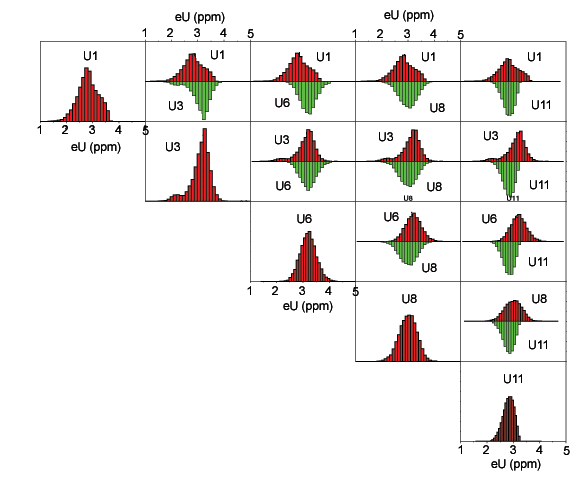
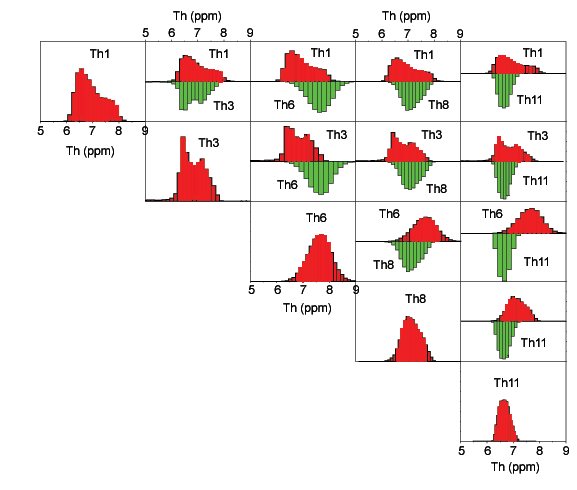
This section discusses a group of classes selected because they appear to be related to the Beaumont Formation. Figure B1 shows a matrix of potassium histograms comparing classes R01, R03, R06, R08, and R11. Figure B2 shows a matrix of the uranium histograms and figure B3 shows a matrix of the thorium histograms.
For class R01, the potassium distribution overlaps that of R03 but has little or no overlap with classes R06, R08, or R11. The uranium distribution of R01 overlaps the uranium distributions of all of the other classes in this group. The thorium distribution of R01 overlaps the thorium distributions of the other classes in this group and may have a bimodal component. The geographical distribution of R01 (see the classification map) is limited and mostly occurs in association with and adjacent to areas of R03. Comparison of the classification map and the geologic map shows that approximately half of the grid cells classified as R01 occur in the general vicinity of areas mapped as the clay and mud member (Qbm) of the Beaumont Formation although only 16 percent of R01 occurs within areas mapped as Qbm (see Table 1 of geology comparisons).
For class R03, the potassium distribution overlaps that of R01 and R11 but has little or no overlap with classes R06 and R08. The uranium distribution of R03 overlaps the uranium distributions of all of the other classes in this group and has a small bimodal component. The thorium distribution of R03 overlaps the thorium distributions of the other classes in this group and is bimodal. The geographical distribution of R03 (see the classification map) is limited and mostly occurs in association with and adjacent to areas of R01 and R11. Comparison of the classification map and the geologic map shows that approximately half of the grid cells classified as R03 occur in the general vicinity of areas mapped as the clay and mud member (Qbm) of the Beaumont Formation although only 17 percent of R03 occurs within areas mapped as Qbm (see Table 1 of geology comparisons).
For class R06, the potassium distribution somewhat overlaps that of R08 but has no overlap with classes R01, R03, or R11. The uranium distribution of R06 overlaps the uranium distributions of all of the other classes in this group. The thorium distribution of R06 overlaps the thorium distributions of classes R01, R03, and R06 but has relatively little overlap with that of R11. Class R06 occurs mostly in the eastern part of the survey area (see the classification map) and about 68 percent of the class occurs within areas mapped either as undivided Beaumont Formation (Qb) or as floodplain deposits of the Beaumont Formation (Qbf) (refer to the geologic map and Table 1 of geology comparisons).
For class R08, the potassium distribution has relatively overlap with the potassium distributions of the other classes in this group. The uranium distribution of R08 overlaps the uranium distributions of the other classes in this group. Similarly, the thorium distribution of R08 overlaps the thorium distributions of the other classes in this group. About 50 percent of R08 occurs within areas mapped as members of the Beaumont Formation and about 32 percent within areas mapped as dune sands (Qds) (refer to the geologic map and Table 1 of geology comparisons).
For class R11, the potassium distribution overlaps that of R03 but has relatively little overlap with the potassium distributions of the other classes in this group. The uranium distribution of R11 overlaps the uranium distributions of the other classes in this group. The thorium distribution of R11 overlaps the thorium distributions of classes R01, R03, and R08 but has relatively little overlap with that of R06. The geographical distribution of R11 (see the classification map) is limited and often occurs in association with and adjacent to areas of R01 and R03. Comparison of the classification map and the geologic map shows that most of the grid cells classified as R11 occur in the general vicinity of areas mapped as the clay and mud member (Qbm) of the Beaumont Formation although only 17 percent of R11 occurs within areas mapped as Qbm (see Table 1 of geology comparisons).
Overall, the association of the classes in this group with the Beaumont Formation is robust. Classes R01, R03, R06, R08, and R11 together account for about 89 percent of the areas mapped as undivided Beaumont Formation (Qb), about 72 percent of areas mapped as floodplain deposits (Qbf), and about 57 percent of areas mapped as clay and mud deposits (Qbm) (refer to Table 1 of geology comparisons).

Figure B1. Matrix of potassium bi-histograms for classes related to the Beaumont Formation. The number denotes the class (refer to the classification map).
[Figure B1][Figure B2][Figure B3]

Figure B2. Matrix of uranium bi-histograms for classes related to the Beaumont Formation. The number denotes the class (refer to the classification map).
[Figure B1][Figure B2][Figure B3]

Figure B3. Matrix of thorium bi-histograms for classes related to the Beaumont Formation. The number denotes the class (refer to the classification map).
[Figure B1][Figure B2][Figure B3]