USGS Open-File Report 2005-1231
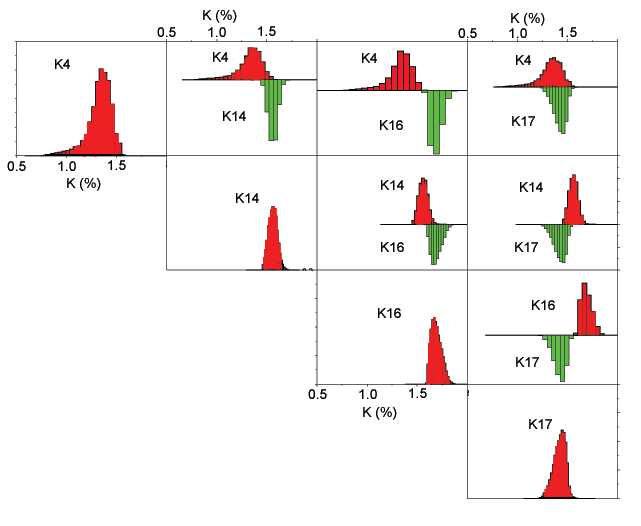
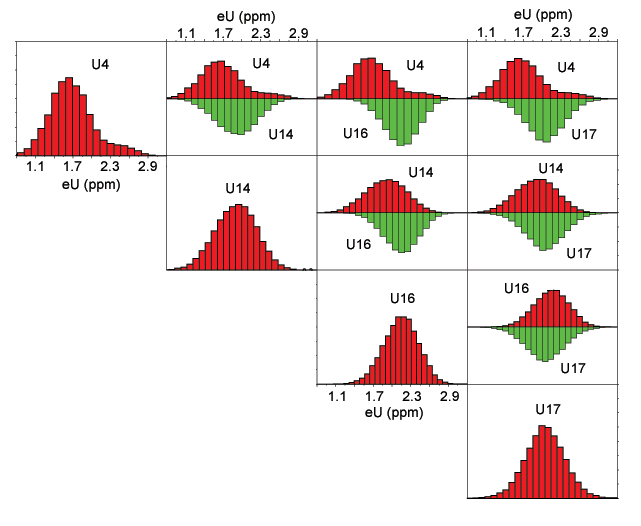
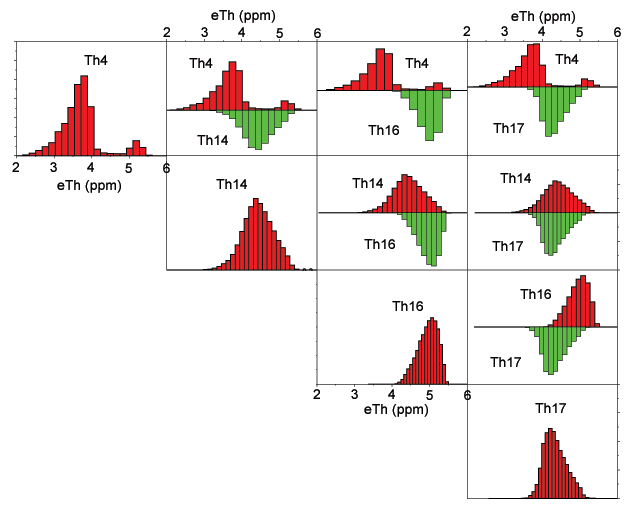
This section discusses a group of classes selected because they appear to be related to the Goliad Formation. Figure G1 shows a matrix of potassium histograms comparing classes R04, R14, R16, and R17. Figure G2 shows a matrix of the uranium histograms and figure G3 shows a matrix of the thorium histograms.
For class R04, the potassium distribution largely overlaps that of class R17, has some overlap with class R14, and has little overlap with the potassium distribution of class R16. The uranium distribution of class R04 largely overlap the uranium distributions of classes R14, R16, and R17. The thorium distribution of R04 has a small bimodal component that has much higher concentrations of thorium than most of the grid cells in this class. The thorium distribution of R04 exhibits some overlap with all of the other classes in this group but the mean values are distinct (see table of mean values). The mean values of all three elements for class R04 are less that the mean values for classes R14, R16, and R17. Comparison of the classification map and the geologic map indicates that class R04 occurs almost exclusively in areas mapped as Goliad Formation. The Goliad Formation is known to contain caliche (Weeks, 1945) and one possibility is that areas identified as class R04 have greater amounts of calcium carbonate in the soil than areas identified as classes R14, R16, and R17. Because calcium carbonate contains very low amounts of the radioactive elements, its presence would cause a reduction in the concentrations of the radioactive elements compared to the same soil without the calcium carbonate. Because the energies of the gamma rays emitted by the radioactive elements and used to estimate their concentrations are similar (1.46 Mev for K40, 1.76 Mev for Bi214of the U238 decay series, and 2.64 Mev for Tl208 of the Th232 decay series), the attenuation of the gamma rays by the calcium carbonate should result in similar percentage reductions in the apparent concentrations. Ratios of the mean values indicate that this is approximately true for classes R14 and R16 but not true for R17.
For class R14, the potassium histogram somewhat overlaps the distributions of the other classes in this group. The mean potassium concentration of R14 is greater than the mean concentrations of classes R04 and R17 but less than that of R16. The uranium distribution of R14 largely overlaps the uranium distributions of the other classes in this group. The thorium distribution of R14 somewhat overlaps that of class R04 and largely overlaps the thorium distributions of classes R16 and R17.

Figure G1. Matrix of potassium bi-histograms for classes related to the Goliad Formation. The number denotes the class (refer to the classification map).
[Figure G1] [Figure G2] [Figure G3]

Figure G2. Matrix of uranium bi-histograms for classes related to the Goliad Formation. The number denotes the class (refer to the classification map).
[Figure G1] [Figure G2] [Figure G3]

Figure G3. Matrix of thorium bi-histograms for classes related to the Goliad Formation. The number denotes the class (refer to the classification map).
[Figure G1] [Figure G2] [Figure G3]