Discussion
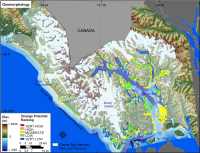
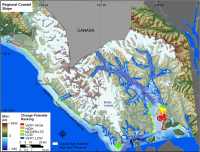
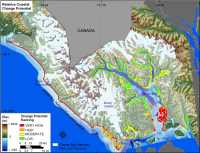
The data within the coastal change-potential index (CPI) show variability at different spatial scales (fig. 13). However, the ranked values for the physical process variables vary less over the extent of the shoreline. The value of the relative sea-level change variable is constant at very high change-potential for the entire study area. The significant wave height values are ranked as very low within the fjords to very high along the open coast of the Gulf of Alaska. The tidal range variable is ranked as moderate (2.0- 4.0 m) to low (4.01 - 6.0 m) change-potential for Glacier Bay proper.
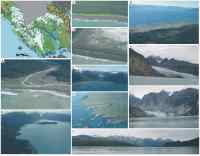
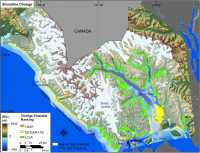
The geologic variables show the most spatial variability and thus have the most influence on CPI variability (fig. 13). Geomorphology in the park includes very high change-potential tidewater glacier termini, high change-potential gravel beaches, moderate change-potential alluvial fans and glacial features, low and very low change-potential rock and cliff features (fig. 6 A-I and fig. 7). Change potential assessment based on shoreline change is moderate with two small areas of low change-potential and a few small areas of high change-potential (fig. 8). Regional coastal slope is in the very low to very high change-potential range for GBNPP (fig. 9).
The most influential variables in the CPI are geomorphology, shoreline change, coastal slope, and wave energy; therefore they may be considered the dominant factors controlling how GBNPP will evolve as sea level changes.