Geologic Variables
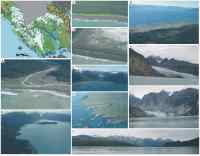
The geomorphology variable expresses the relative erodibility of different landform types (table 1). These data were derived using surficial geology, ice extent, topographic maps and oblique aerial photography.
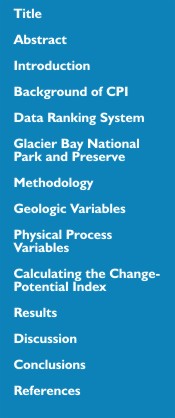
The geology and ice extent information are available on the Glacier Bay Ecosystem GIS CD-ROM (Geiselman and others, 1997). The oblique aerial photos were collected during a field visit (fig. 6 A-I). Descriptions in the book Living with the Coast of Alaska (Mason and others, 1997) were also used to help inform the geomorphologic classification. GBNPP contains several geomorphologic types, including low to very low change-potential rock cliffs, moderate change-potential alluvial and glacial deposits, high change-potential gravel and sand beaches, and very high change-potential tidewater glacier termini (fig. 6 A-I and fig. 7).
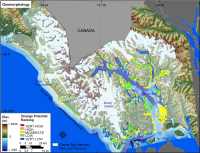
Shoreline change-potential (erosion/accretion) for GBNPP were estimated using oblique aerial photos and an interview with an expert in shoreline dynamics along the Gulf of Alaska (B. Molnia, personal communication, Nov., 2004). Historical digital vector shorelines typically used to calculate a rate of shoreline change were not available for Glacier Bay, so the oblique aerial photos were used in conjunction with regional expertise. Because shoreline change-potential data were derived qualitatively, the categories for shoreline change were limited to high, moderate, and low. Shoreline change-potential was not assigned to the very low or very high categories. Rock cliff areas were assigned low shoreline change-potential, because rock cliffs are not likely to experience significant erosion or accretion annually. Unconsolidated sediments were generally classified as moderate shoreline change-potential. Areas within Glacier Bay where glaciers reached at or near the shoreline were classified as high shoreline change-potential. Shoreline change-potential for GBNPP range from low change-potential (areas not likely to experience significant shoreline change annually) to high change-potential (areas where shoreline change will likely occur within one year) (table 1).Two areas within the park have been experiencing historic accretion: Taylor Bay and the western edge of the Gustavus outwash plain (B. Molnia, personal communication, Nov., 2004). The outer coast north of Icy Point would have the potential for a trend of long-term shoreline erosion due to high wave energy and gravel beaches; however periodic tectonic events (~ 1 event/ 100 years) result in an overall stable shoreline position (Molnia, 1986).
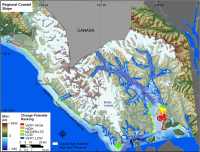
Regional coastal slope is an indication of the relative change-potential to inundation and the potential rapidity of shoreline retreat because low-sloping coastal regions should retreat faster than steeper regions (Pilkey and Davis, 1987). The regional slope of the coastal zone was calculated from a grid of topographic and bathymetric elevations extending 10 km landward and seaward of the shoreline. Elevation data were obtained from the National Geophysical Data Center (NGDC) as gridded topographic and bathymetric elevations at 0.1-meter vertical resolution for 1-minute grid cells, and higher resolution bathymetric and topographic data on the Glacier Bay Ecosystem GIS CD-ROM (Geiselman, 1997). Regional coastal slopes for Glacier Bay fall within the very low to very high change-potential category (< 4.55% - > 14.7%)(fig. 9).