 |
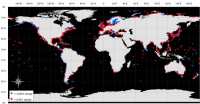
| Figure 1. Global distribution of water-level recording stations as reported by the Permanent Service for Mean Sea Level (PSMSL, 2005). Nearly three-quarters of the stations report an increase in sea-level relative to the land surface.Click on figure for larger image. |
The National Park Service (NPS) is responsible for managing nearly 12,000 km (7,500 miles) of shoreline along oceans and lakes. In 2001, the U.S. Geological Survey (USGS), in partnership with the NPS Geologic Resources Division, began conducting assessments of the effects of future sea-level change by creating maps to assist NPS in managing its valuable coastal resources. This report presents the results of a potential for change assessment for GBNPP, highlighting areas that are likely to be most affected by future sea level and coastal change.
Global sea level has risen approximately 18 centimeters (7.1 inches) in the past century (Douglas, 1997). Climate models predict an additional rise of 48 cm (18.9 in.) by 2100 (IPCC, 2002), which is more than double the rate of rise for the 20th century. Sea level is rising relative to the land surface in more than 74 percent of the locations where there are water level recording stations worldwide (fig. 1). In the United States more than 85 percent of the coastline is experiencing a relative increase in sea level (Permanent Service for Mean Sea Level, http://www.nbi.ac.uk/psmsl/datainfo/rlr.trends). Glacier Bay and most of southeastern Alaska are among the small percentage of the world's coastline experiencing a fall in relative sea-level due to uplift of the land through glacial rebound and isostatic adjustments. Potential coastal impacts of sea-level fall include dewatering and water quality reduction in wetlands and estuaries, decreases in harborage area, channel shoaling, increased dredging needs, subaerial exposure of polluted marine sediments, gullies and erosion near rivers and streams associated with base-level changes, and habitat loss. The Great Lakes and the Dead Sea are examples of areas where resource managers must try to mitigate impacts associated with falls in water levels (US Global Change Research Program, 2000; Hassan, and Klein, 1999).
Predicted accelerated global sea-level rise has generated a need in coastal geology to determine the likely response of a coastline to sea-level change. An accurate and quantitative approach to predicting coastal change is difficult to establish. Even the kinds of data necessary to predict shoreline response are the subject of scientific debate. A number of predictive approaches that primarily focus on sea-level rise impacts have been proposed (National Research Council, 1990 and 1995), including:
- extrapolation of historical data (e.g., coastal erosion rates),
- static inundation modeling,
- application of a simple geometric model (e.g., the Bruun Rule),
- application of a sediment dynamics/budget model, or
- Monte Carlo (probabilistic) simulation based on parameterized physical forcing variables.
However, each of these approaches has inadequacies or can be invalid for certain applications (National Research Council, 1990). Additionally, shoreline response to sea level is further complicated by human modification of the natural coast such as beach nourishment projects, and engineered structures such as seawalls, revetments, groins, and jetties. Understanding how a natural or modified coast will respond to sea-level change is essential to preserving coastal resources.
The primary challenge in predicting shoreline response to sea-level change is quantifying the important variables that contribute to coastal evolution in a given area. In order to address the multi-faceted task of predicting sea-level change impact, the USGS has implemented a methodology to identify areas that may be most likely to experience coastal change (Thieler and Hammar-Klose, 1999). This technique known as the Coastal Vulnerability Index (CVI) utilizes different ranges of vulnerability (low to very high) to describe a coast's susceptibility to physical change as sea level rises. The coastal vulnerability index was modified for coasts where sea level is falling and a slightly different index was developed, the coastal change-potential index (CPI). The CPI used here focuses on the same six variables as the CVI that strongly influence coastal evolution:
- Geomorphology
- Historical shoreline change rate
- Regional coastal slope
- Relative sea-level change
- Mean significant wave height
- Mean tidal range
These variables can be divided into two groups: 1) geologic variables and 2) physical process variables. The geologic variables are geomorphology, historic shoreline change rate, and coastal slope; they account for a shoreline's relative resistance to erosion, long-term erosion/accretion trend, and its susceptibility to flooding or subaerial exposure, respectively. The physical process variables include significant wave height, tidal range, and sea-level change, all of which contribute to the process-induced changes on a particular section of coastline over time scales from hours to centuries. A relatively simple change-potential ranking system (table 1) allows the six variables to be incorporated into an equation that produces a change-potential index (CPI). The CPI can be used by scientists and park managers to evaluate the likelihood that physical change may occur along a shoreline as sea level continues to change. Additionally, NPS staff will be able to incorporate information provided by this change-potential assessment technique into general management plans.
Back to Top |