Geologic Variables
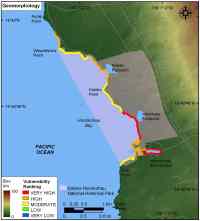
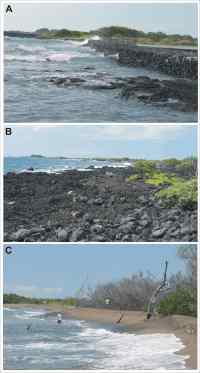
The geomorphology variable expresses the relative erodibility of different landform types (table 1). These data were derived from 2000 vertical aerial photography provided by NOAA's Center for Coastal Monitoring and Assessment's Benthic Habitat Mapping of the Main Hawaiian Islands (table 2) (Coyne and others, 2003). In addition, field visits were made within accessible locations of the park to verify the geomorphologic classification (fig. 3 and fig. 4 A-C). The coastal geomorphology of Kaloko-Honokohau NHP includes moderate vulnerability rocky coastline backed by carbonate storm beaches, high vulnerability coral rubble areas, and very high vulnerability mangrove and sand beaches ((fig. 3 and fig. 4 A-C).
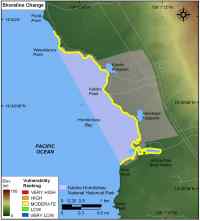
Shoreline erosion and accretion rates for Kaloko-Honokohau NHP were available from USGS at 50 m intervals (transects) along the coast (table 2) (Hapke written communication, 2005). The change rates for each transect within a 500-meter grid cell were averaged to determine the shoreline change value used here, with positive numbers indicating accretion and negative numbers indicating erosion. Shoreline change rates in Kaloko-Honokohau all fell within +1 to -1 m/yr (moderate vulnerability) ( fig. 5). For higher resolution shoreline change data (not averaged over a 500-meter section of coast) see Hapke and others (2005).
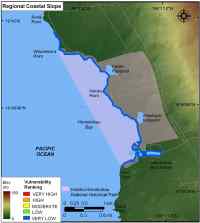
Regional coastal slope is an indication of the relative vulnerability to inundation and the potential rapidity of shoreline retreat because low-sloping coastal regions should retreat faster than steeper regions (Pilkey and Davis, 1987). The regional slope of the park was calculated from a grid of topographic and bathymetric elevations extending 5 km landward and seaward of the shoreline. Elevation data were obtained from the National Geophysical Data Center (NGDC) as gridded topographic and bathymetric elevations at 0.1-meter vertical resolution for 90-meter (table 2) cells. Regional coastal slopes for Kaloko-Honokohau National Historical Park fall within the very low vulnerability category (> 14.7%) (fig. 6).