
Open-File Report 2005-1293
Title Page / Table of Contents / List of Figures / Introduction / Maps / Data Collection/Processing / Interpretation / Acknowledgments / Appendix 1 / Appendix 2 / Appendix 3 / Appendix 4
 |
 |
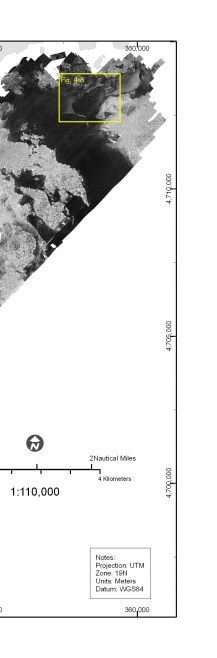 |
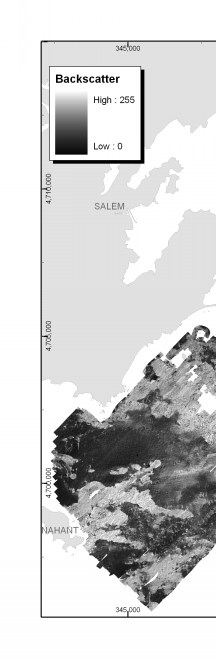
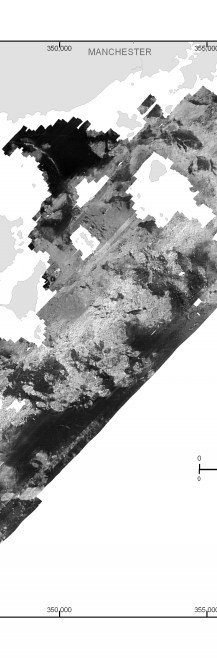
Figure 3.3. Map showing acoustic backscatter intensity offshore of northeastern Massachusetts between Nahant and Gloucester. Backscatter intensity, as recorded with sidescan sonar, is an acoustic measure of the hardness and roughness of the seafloor. In general, higher values (light tones) represent rock, gravel and coarse sand. Lower values (dark tones) generally represent fine sand and muddy sediment. Yellow box (upper right) indicates the location of Figure 4.8. | ||


![]() U.S. Department of the Interior |
U.S. Geological Survey
U.S. Department of the Interior |
U.S. Geological Survey
URL: http://pubsdata.usgs.gov/pubs/of/2005/1293/html/imagepages/fig3_3.html
Page Contact Information: GS Pubs Web Contact
Page Last Modified: Friday, 03-May-2024 14:38:15 EDT

