
Open-File Report 2005-1293
Title Page / Table of Contents / List of Figures / Introduction / Maps / Data Collection/Processing / Interpretation / Acknowledgments / Appendix 1 / Appendix 2 / Appendix 3 / Appendix 4
 |
 |
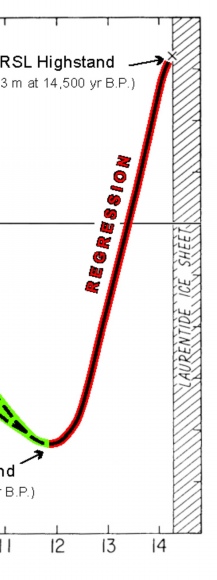 |
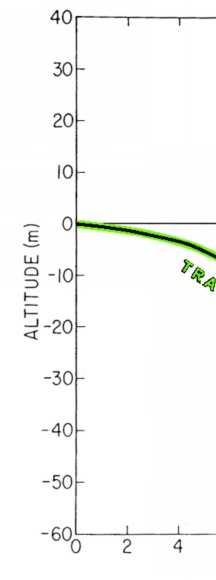
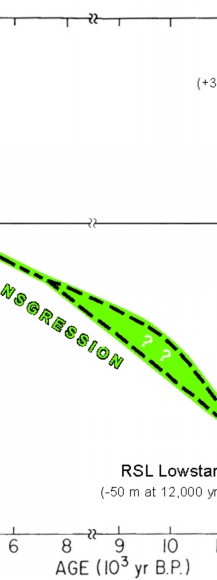
Figure 4.1. Late Quaternary relative sea-level curve for northeastern Massachusetts (modified from Oldale and others, 1993). Over the last 14,500 years, relative sea level fell from a highstand of about +33 m to a lowstand of about -50 m, and then rose at varying rates to the present. These large fluctuations in relative sea level drove regression (red shading) and transgression (green shading) of the shoreline across the inner continental shelf. The dashed lines indicate uncertainty in the sea-level data. Note that the age scale changes at 8,000 years B.P. | ||


![]() U.S. Department of the Interior |
U.S. Geological Survey
U.S. Department of the Interior |
U.S. Geological Survey
URL: http://pubsdata.usgs.gov/pubs/of/2005/1293/html/imagepages/fig4_1.html
Page Contact Information: GS Pubs Web Contact
Page Last Modified: Friday, 03-May-2024 15:38:59 EDT

