
Open-File Report 2005-1293
Title Page / Table of Contents / List of Figures / Introduction / Maps / Data Collection/Processing / Interpretation / Acknowledgments / Appendix 1 / Appendix 2 / Appendix 3 / Appendix 4
 |
 |
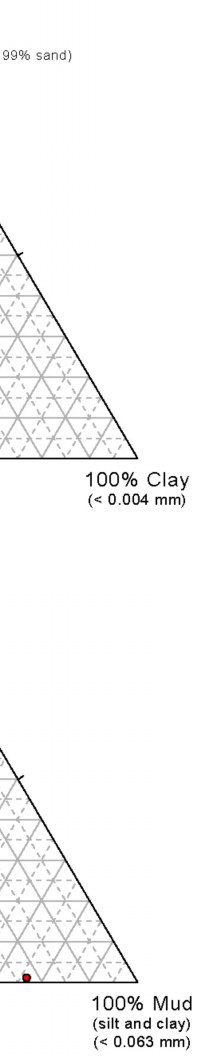 |
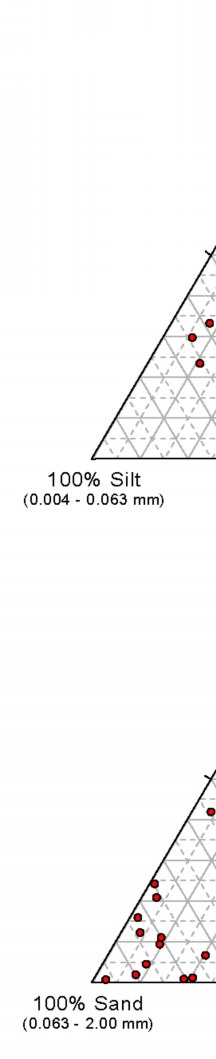
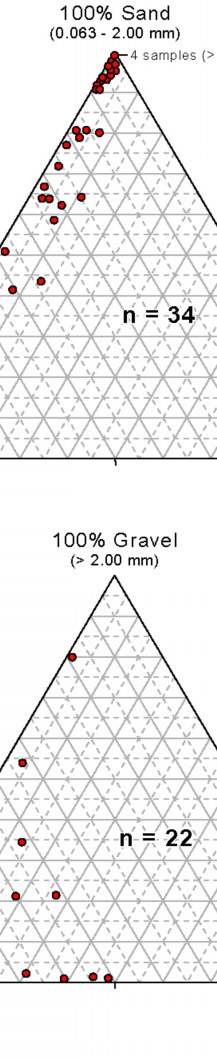
Figure 4.10. Ternary diagrams depicting the texture of surficial sediment collected in grab samples. The apexes of the diagrams represent 100% of the labeled textural component (i.e., gravel, sand, silt, and or clay). The upper diagram depicts 34 samples that lack gravel; the lower diagram depicts 22 samples that contain at least 0.5% gravel. See table 4.2 for additional information on these samples. | ||


![]() U.S. Department of the Interior |
U.S. Geological Survey
U.S. Department of the Interior |
U.S. Geological Survey
URL: http://pubsdata.usgs.gov/pubs/of/2005/1293/html/imagepages/fig4_10.html
Page Contact Information: GS Pubs Web Contact
Page Last Modified: Friday, 03-May-2024 15:45:48 EDT

