
Open-File Report 2005-1293
Title Page / Table of Contents / List of Figures / Introduction / Maps / Data Collection/Processing / Interpretation / Acknowledgments / Appendix 1 / Appendix 2 / Appendix 3 / Appendix 4
 |
 |
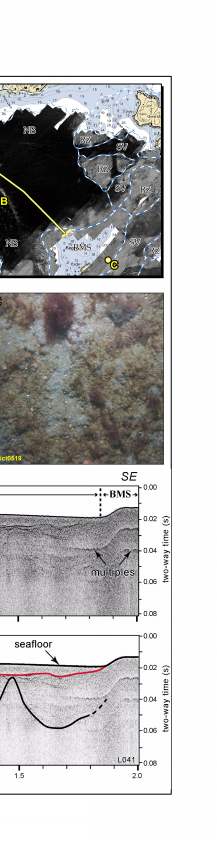 |
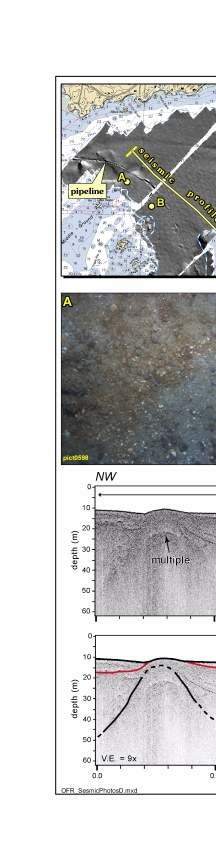
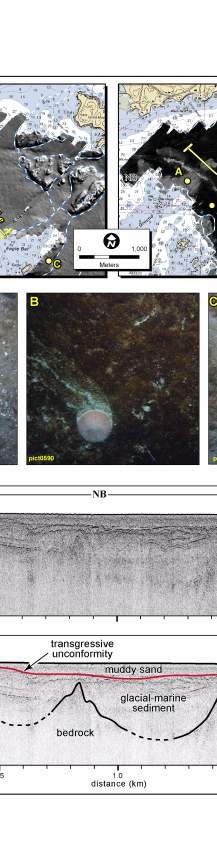
Figure 4.5. Maps of seafloor topography (upper left) and backscatter intensity (upper right) in Salem Sound. Both maps are overlain on NOAA-NOS nautical chart #13275. Dashed lines show boundaries of physiographic zones, which are based on seafloor topography and dominant substrate properties. See figure 4.4 for location of maps. Bottom photographs A-C (middle) and seismic-reflection profile (bottom) are indicated by yellow circles and line, respectively. The distance across the bottom of the photographs is approximately 50 cm. | ||


![]() U.S. Department of the Interior |
U.S. Geological Survey
U.S. Department of the Interior |
U.S. Geological Survey
URL: http://pubsdata.usgs.gov/pubs/of/2005/1293/html/imagepages/fig4_5.html
Page Contact Information: GS Pubs Web Contact
Page Last Modified: Friday, 03-May-2024 15:42:07 EDT

